Bitcoin Price Prediction – Why BTC Could See Downside Thrust Before Upside
Key Takeaways:
- Bitcoin is correcting gains from the $65,500 resistance.
- BTC/USD seems to be following a bullish flag pattern with resistance at $68,000 on the daily chart.
- The price could start a fresh surge if there is a close above the 50-day simple moving average (blue) and $68,000.
NEW DELHI (CoinChapter.com) — Bitcoin price is struggling to clear the $65,500 resistance zone. BTC is moving lower and might test the $56,000 support before the bulls take a stand.
Bitcoin Price Dips Again
In the past few analyses, we saw rejection patterns for Bitcoin. BTC struggled to stay above important support levels such as $61,200 and $60,000. The last drop was toward the $56,500 level before the bulls took a stand.
The price seems to be following a bullish flag pattern with resistance at $68,000 on the daily chart. The recent recovery wave was from the channel support zone. The price climbed above the $60,000 and $62,000 resistance levels.
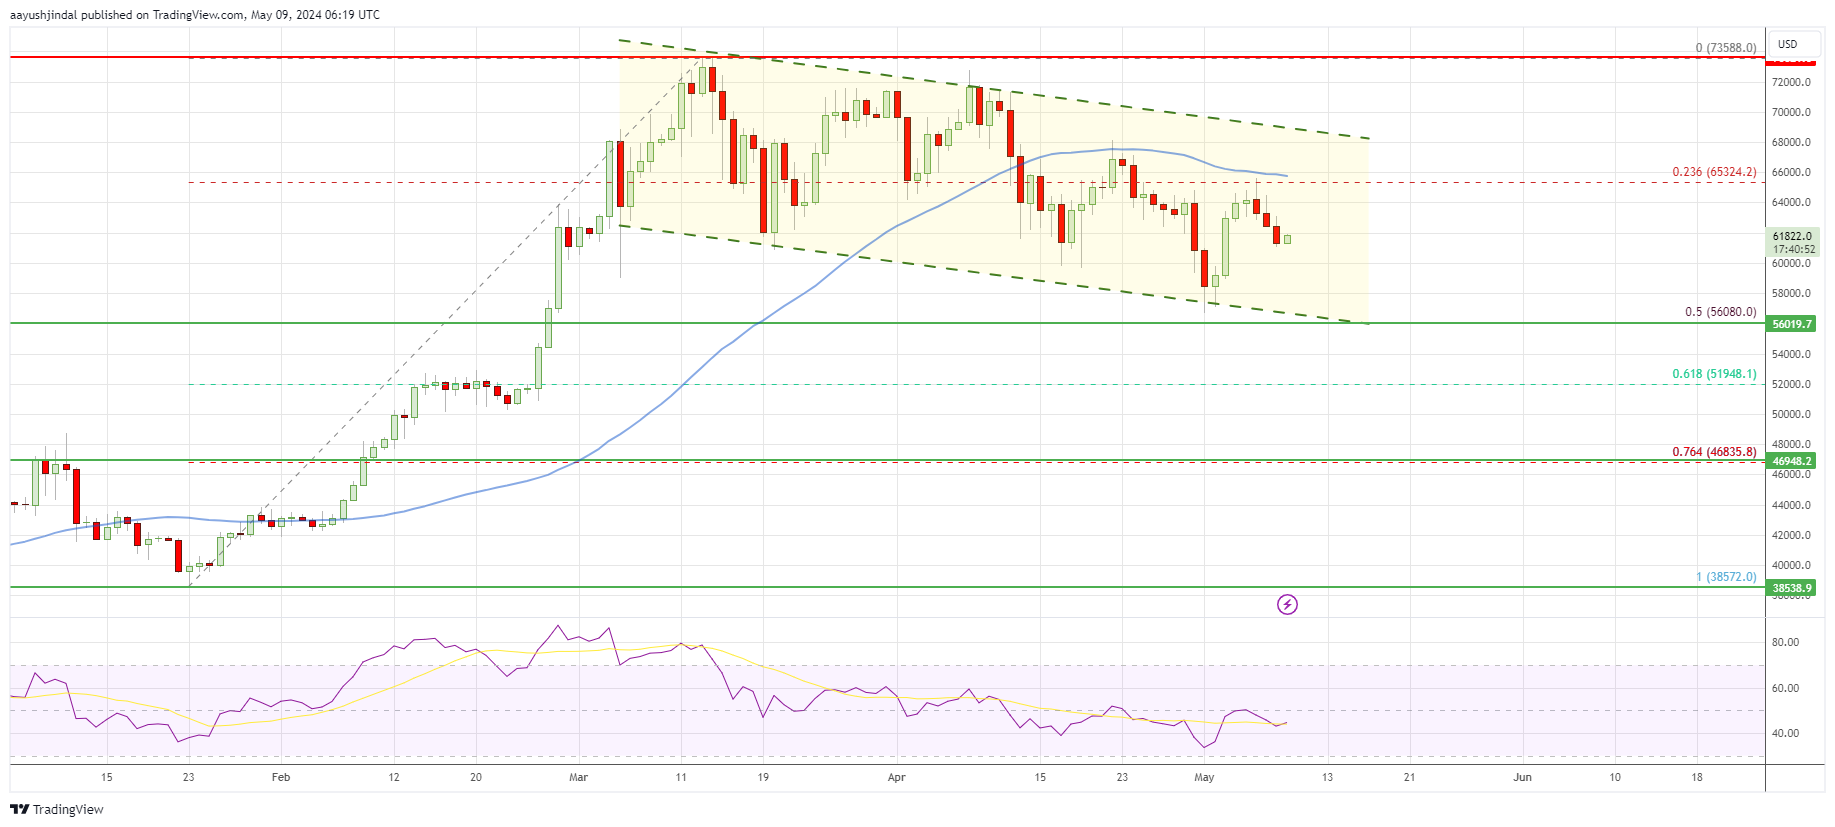
Bitcoin price even surpassed the $63,500 resistance level. However, the bears were active near the $65,500 resistance level and the 50-day simple moving average (blue).
There was a clear rejection pattern near $65,500 and BTC price is again moving lower. If the bears remain in action, the price could decline toward the $60,000 support zone. The first major support is near the $58,000 zone.
The next support is now forming near the $57,200 zone. The main uptrend support is now near the $56,000 region, the channel lower trend line, and the 50% Fib retracement level of the upward move from the $38,572 swing low to the $73,588 high.
If the bulls fail to protect the $56,000 support, there could be a larger decline. In the stated case, the price might decline toward the $46,850 support or the 76.4% Fib retracement level of the upward move from the $38,572 swing low to the $73,588 high.
Dips and Rip In BTC?
Conversely, Bitcoin price might remain stable above $56,000 and start a fresh increase. Immediate resistance is near the $64,200 level. The first major resistance is near the $65,500 level and the 50-day simple moving average (blue).
The main resistance is now near the $68,000 level. To continue higher and gain bullish momentum, the price must settle above the $68,000 resistance and the 50-day simple moving average (blue). The next key resistance sits at $70,000, above which the price could accelerate higher. A daily close above the $70,000 resistance zone could open the doors for a move toward the $80,000 region.
Overall, Bitcoin price is signaling more downsides below the $60,000 level. However, BTC/USD is still in a larger uptrend unless there is a daily and weekly close below the $56,000 level.
The post Bitcoin Price Prediction – Why BTC Could See Downside Thrust Before Upside appeared first on CoinChapter.