Daily Market Review: BTC, ETH, AIOZ, SOL, RNDR
Today’s market session has seen bears take dominance as seen from the decreasing global market cap. The total cap stood at $2.35T as of press time, representing a 1.7% drop over the last 24 hours. The trading volume jumped by 55% over the same period to stand at $76.6B.
Bitcoin Price Review
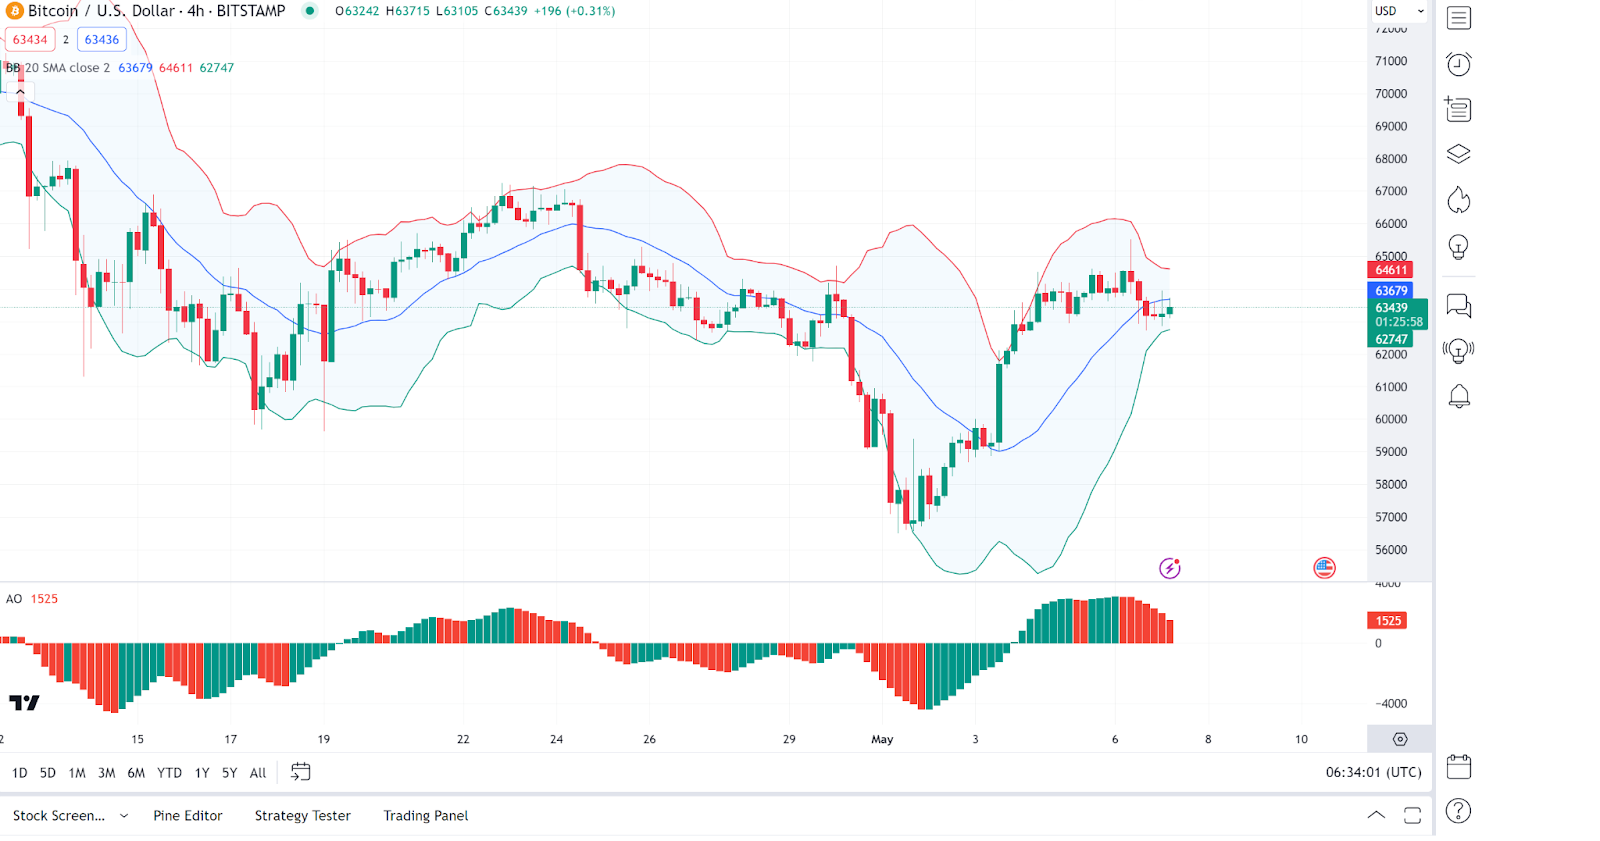
Bitcoin (BTC) is now facing consolidations in today’s session after the recent pump, evidenced by its price movements. Analysing Bitcoin price charts, we see that the price is currently close to the upper Bollinger band but trending downward, suggesting a potential pullback or consolidation after a recent price rise. The moving average (blue line) shows the price has risen above it but is now testing this level from above, possibly finding support.
If the Bitcoin price holds above the moving average and the middle Bollinger band, it might continue to rise, targeting the upper band. A break below could see a retest of the lower Bollinger band levels. As of press time, the Bitcoin price stood at $63,636, representing a 1.03% drop from its previous 24-hour price.
Ethereum Price Review
Ethereum (ETH) is also facing corrections in today’s session after the pump witnessed yesterday and over the weekend. Looking at an in-depth analysis, we see that the Ethereum price is weaving around the Alligator’s mouth (the balance lines), indicating a lack of clear direction and possible consolidation.
On the other hand, looking at other indicators, we see the MFI (Money Flow Index) suggests moderate buying interest. As of press time, the Ethereum price stood at $3,071, representing a 3.2% drop from its previous 24-hour price.

AIOZ Network Price Review
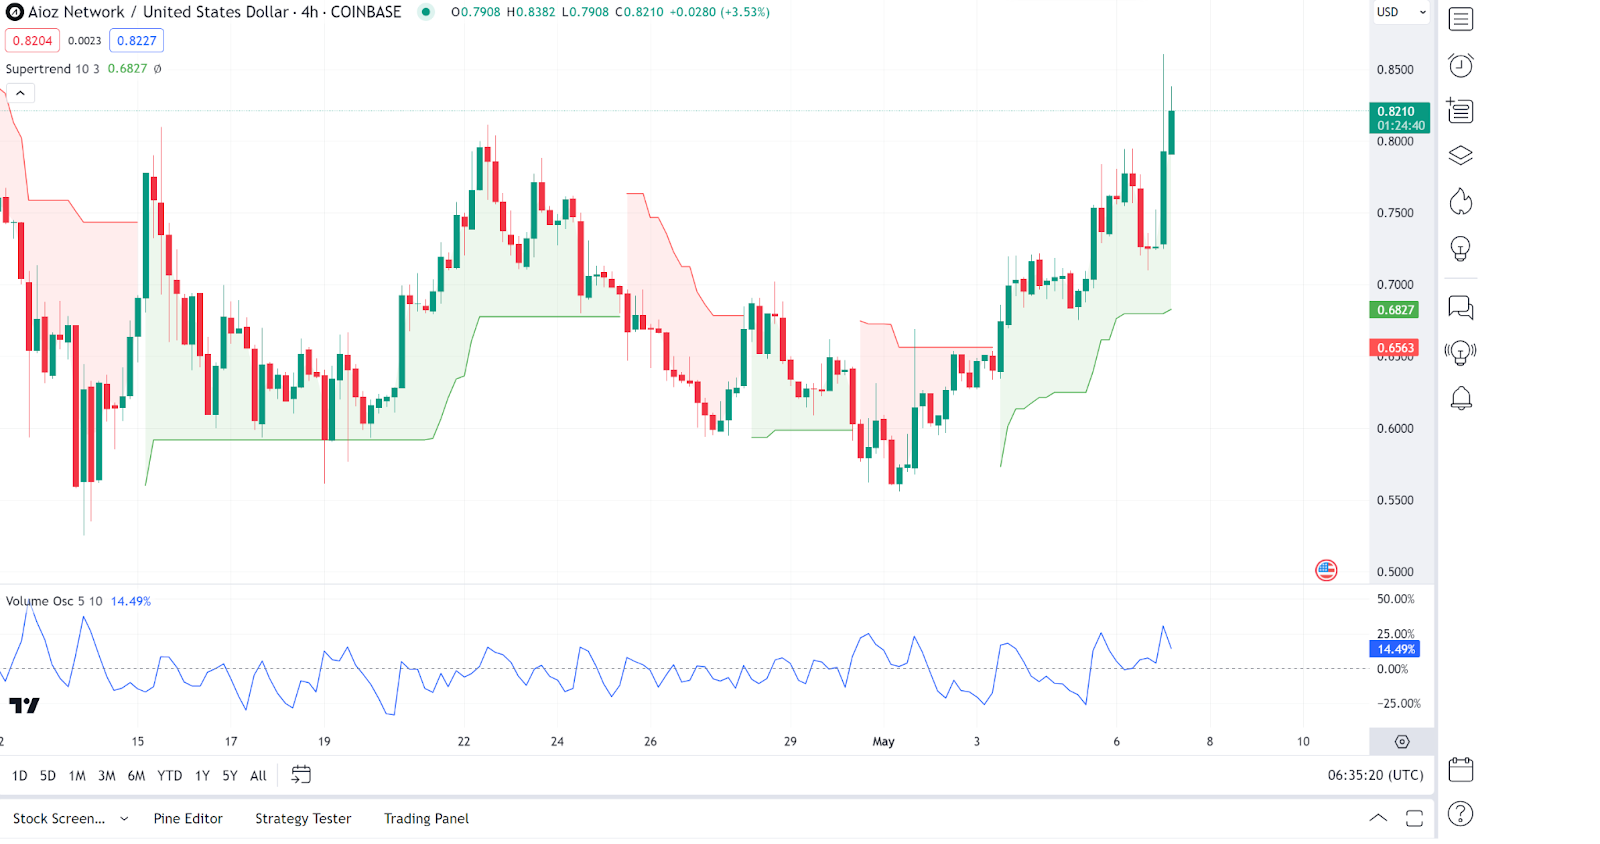
AIOZ Network (AIOZ) is today’s top gainer as evidenced by its price movements. Analysing AIOZ Netwrok price charts, we see that a recent strong upward move is shown by the price moving above the Supertrend line, indicating a bullish trend.
On the other hand, looking at extra indicators we se that the Volume Oscillator’s positive value indicates healthy buying volume. As of press time, the AIOZ Network price stood at $0.8174, representing a 3.53% pump from its previous 24-hour price.
Solana Price Review
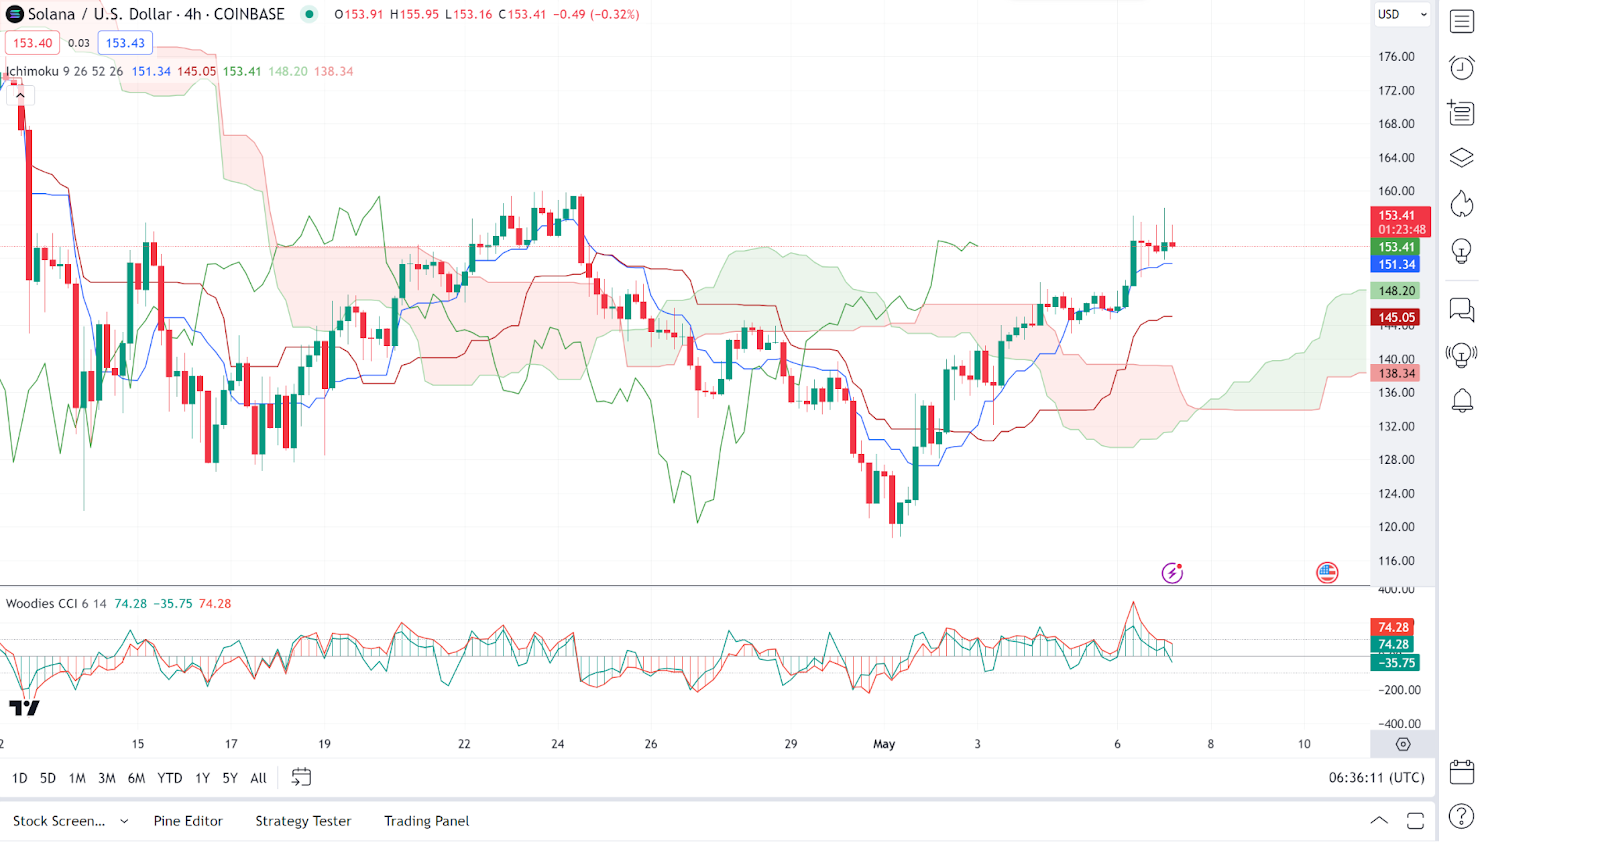
Solana (SOL) is also another gainer in today’s session as evidenced by its price movements. Analysing Solana price charts, we see that the price is trending above the Ichimoku Cloud, suggesting a bullish environment.
However, looking at other indicators, wee see the Woodies CCI shows some overbought conditions that might indicate a potential pullback or consolidation. As of press time, the Solana price stood at $154.46, representing a 3.71% pump from its previous 24-hour price.
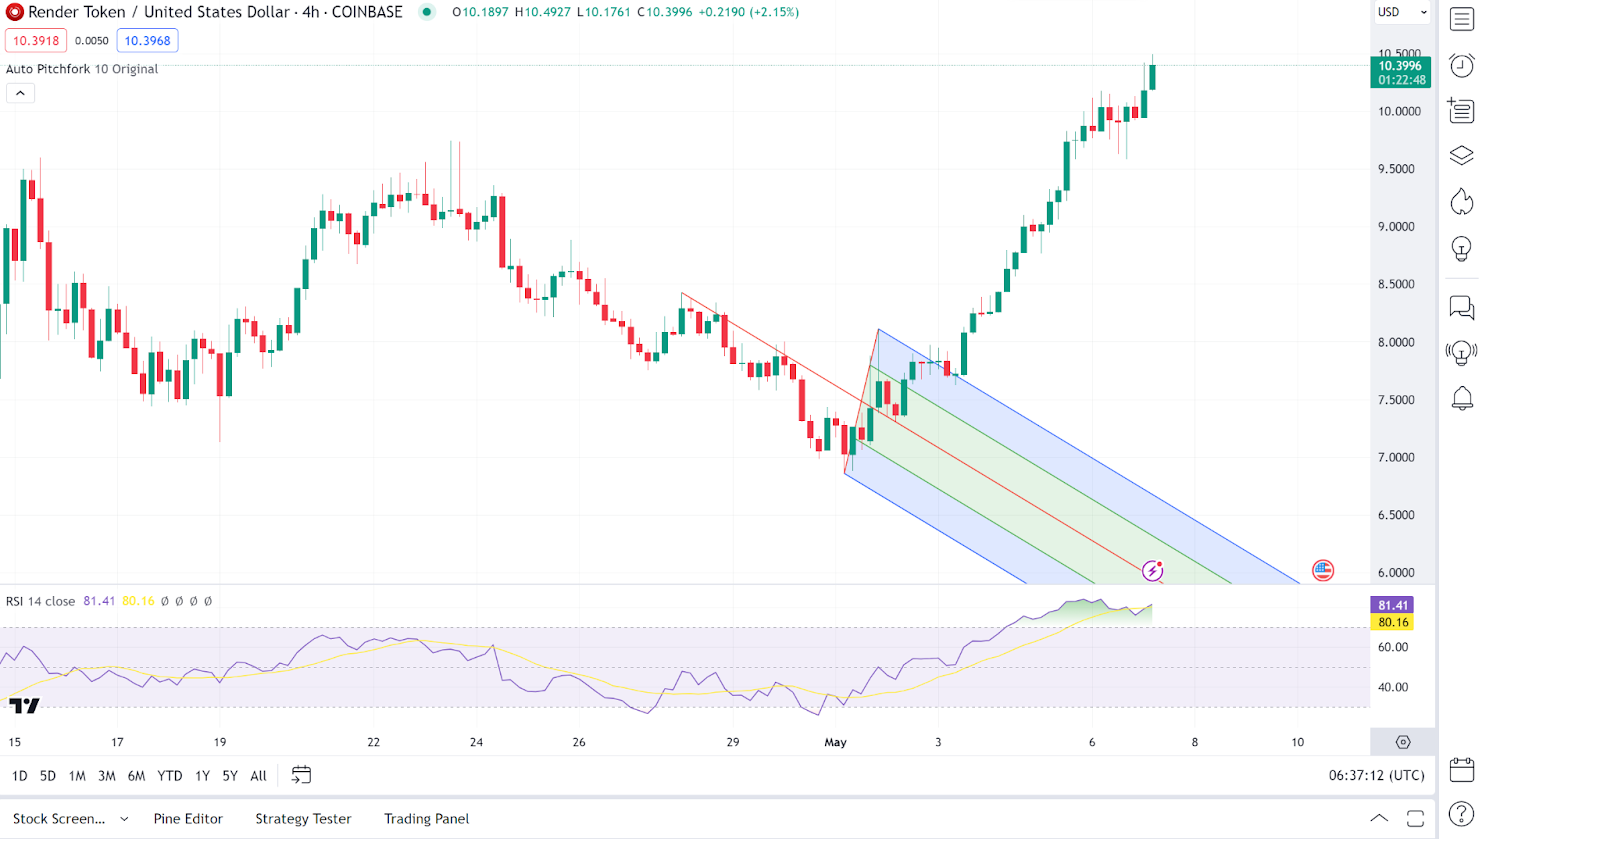
Render Price Review
Render (RNDR) is also another gainer in today’s session as evidenced by its price movements. Looking at an in-depth analysis of Solana price charts we see that the the Solana price has broken out of the downward channel indicated by the Pitchfork and is currently making strong upward movements.
On the flip side, we observe that the RSI is high, suggesting overbought conditions which might lead to a pullback. However, if the Render price can consolidate above the recent breakout level, further gains could be seen. As of press time, the Render price stood at $10.43, representing a 4.2% pump from its previous 24-hour price.