Crypto Price Analysis: BTC, ETH, XRP, DOGE, SHIB Skyrocket After Recent Crash
In the wake of a recent crypto market crash, the landscape has swiftly transformed, with prices rebounding significantly across various digital assets. As of the latest data, the global crypto market cap stands at a robust $2.37 trillion, marking a notable 7.16% surge over the past day. Bitcoin (BTC), Ethereum (ETH), XRP, Dogecoin (DOGE), and Shiba Inu (SHIB) each exhibit their unique patterns.
These coins have witnessed notable surges in both price and trading volumes, indicative of heightened market activity and investor interest. This crypto price analysis delves into the recent price movements and market sentiments across major cryptocurrencies, shedding light on their current trajectories and potential future trends.
Bitcoin (BTC) Price Analysis

Bitcoin has experienced notable price movement, currently priced at $63,866, marking a significant increase of 7.74% within the last 24 hours. This surge in price has been accompanied by a notable rise in trading volume, which has increased by 19.02% and now stands at $33,601,615,355. Such a substantial uptick in trading volume suggests heightened market activity and interest in BTC.
The Relative Strength Index (RSI) for Bitcoin is currently at 50, indicating a neutral sentiment among traders. An RSI of 50 suggests that the buying and selling pressures are relatively balanced, neither favoring overbought nor oversold conditions. This neutrality in sentiment could imply a certain level of stability in the market, with investors cautiously observing price movements before committing to significant positions.
Furthermore, Bitcoin is trading above its 20-day Simple Moving Average (SMA), which is often considered a bullish signal. This indicates that the average price of Bitcoin over the past 20 days is higher than its current price, suggesting positive momentum in the short term. Traders often use moving averages to gauge the direction of the trend, and trading above the 20-day SMA is typically interpreted as a bullish signal, indicating potential upward momentum in the near future.
Ethereum (ETH) Price Analysis
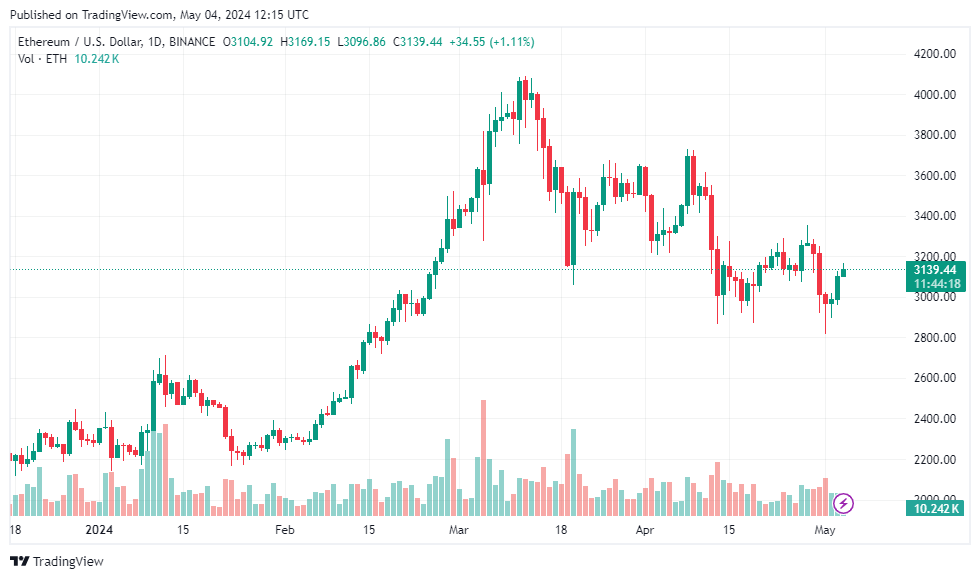
Ethereum has shown notable price movement, currently priced at $3,128, reflecting a noteworthy increase of 5.00% within the last 24 hours. This upward movement in price is accompanied by a moderate rise in trading volume, which has increased by 7.63% and now stands at $12,329,107,184. This increase in trading volume suggests a growing level of market activity and interest in ETH.
The RSI for Ethereum is currently at 47.71, indicating a neutral sentiment among traders. With an RSI below 50, Ethereum’s market sentiment leans slightly towards the bearish side, suggesting that selling pressure may be slightly outweighing buying pressure at present. However, this sentiment is still within a neutral range, implying a balance between buyers and sellers in the market.
Similar to Bitcoin, Ethereum is also trading above its 20-day SMA, which is often interpreted as a bullish signal. This suggests that the average price of Ethereum over the past 20 days is higher than its current price, indicating positive momentum in the short term. Taking these factors into consideration, Ethereum appears to be displaying signs of strength in the current market context.
XRP Price Analysis
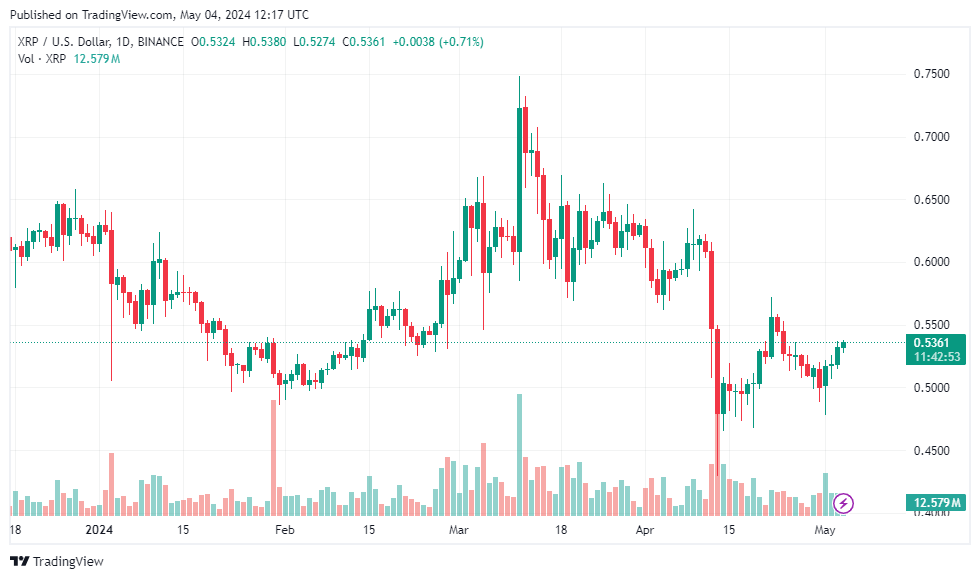
XRP has demonstrated a modest price increase, currently valued at $0.5346, representing a gain of 3.52% within the past 24 hours. Despite this uptick in price, there has been a decrease in trading volume by 13.24%, with the current volume resting at $919,804,370. This decline in trading volume suggests a decrease in market activity and potentially a lack of significant interest in XRP compared to other assets.
The RSI for XRP is currently at 49.7113, indicating a neutral sentiment among traders. With the RSI hovering just below the 50 mark, XRP’s sentiment leans slightly towards the bearish side, suggesting a balance between buying and selling pressures. While the sentiment is not strongly bullish or bearish, it does imply a certain level of indecision or equilibrium in the market.
Similar to BTC and ETH, XRP is also trading above its 20-day SMA, which can be interpreted as a bullish signal. Considering these factors, XRP appears to be experiencing moderate price movement, with a slight increase in value accompanied by a decrease in trading volume. The neutral sentiment indicated by the RSI suggests a degree of uncertainty among traders, potentially resulting in subdued market activity. However, trading above the 20-day SMA implies some level of bullish momentum in the short term.
Dogecoin (DOGE) Price Analysis
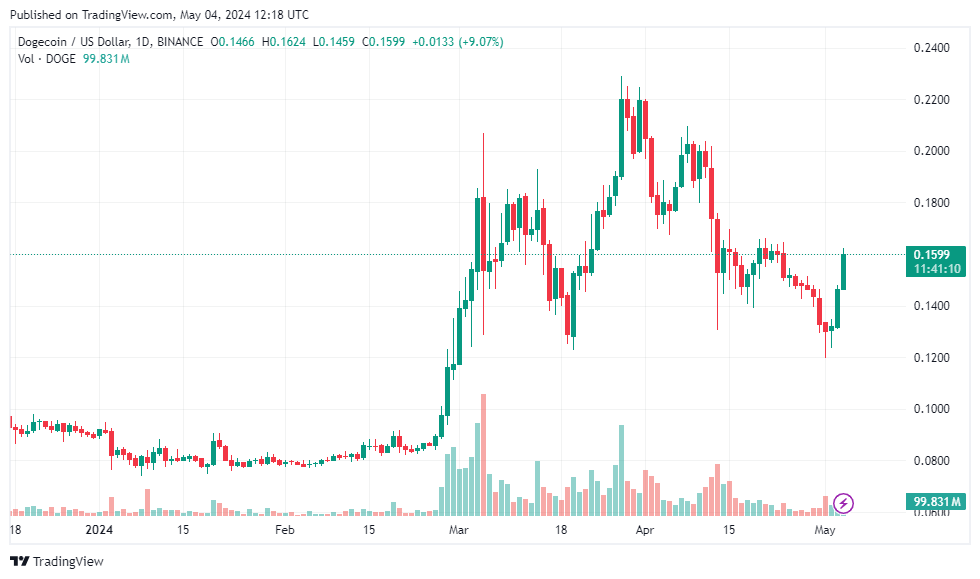
Dogecoin, the leading meme coin, has witnessed significant price movement after the recent crypto crash, currently valued at $0.1583, marking a notable increase of 19.31% within the last 24 hours. This substantial uptick in price is accompanied by a significant surge in trading volume, which has surged by 70.55% and now stands at $1.94 billion. Such a substantial increase in trading volume suggests a heightened level of market activity and interest in DOGE.
The RSI for Dogecoin is currently at 53.36814, indicating a neutral sentiment among traders. With the RSI slightly above 50, Dogecoin’s sentiment leans slightly towards the bullish side, suggesting a balance between buying and selling pressures. This neutral sentiment implies a certain level of stability in the market, with neither buyers nor sellers dominating the direction of price movement.
Similar to other cryptocurrencies, Dogecoin is also trading above its 20-day Simple Moving Average, which is often interpreted as a bullish signal. This suggests that the average price of Dogecoin over the past 20 days is higher than its current price, indicating positive momentum in the short term. Overall, Dogecoin appears to be demonstrating strong price performance in the current market environment. The significant price increase, coupled with a substantial rise in trading volume, indicates growing investor interest and participation in DOGE.
Shiba Inu (SHIB) Price Analysis
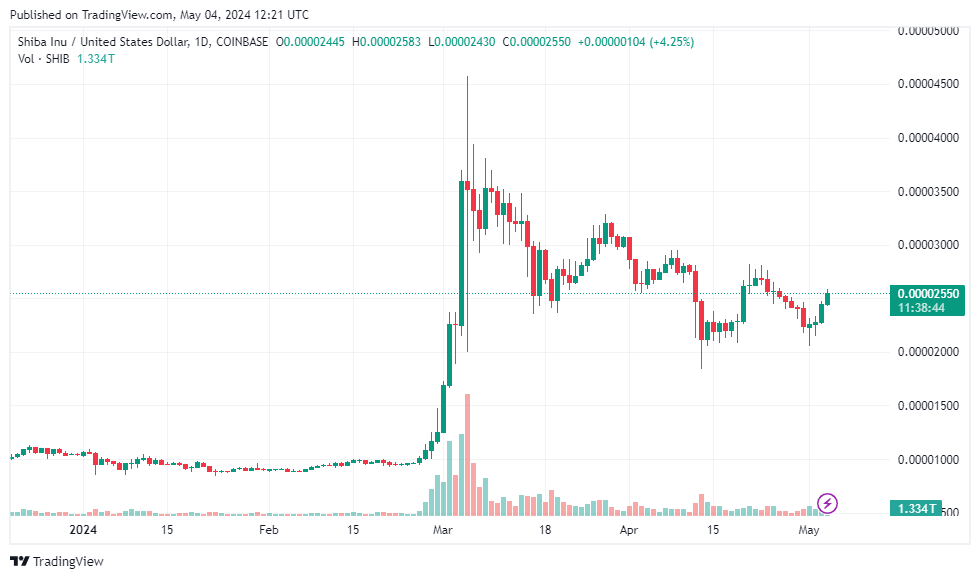
Shiba Inu has experienced notable price movement, currently valued at $0.0000255, experiencing an increase of 11.80% within the last 24 hours. This upward movement in price is accompanied by a significant rise in trading volume, which has surged by 35.62% and now stands at $827.37 million. This increase in trading volume indicates heightened market activity and growing interest in SHIB.
The RSI for the meme coin is currently at 53.44086397, indicating a neutral sentiment among traders. With the RSI hovering around 50, Shiba Inu’s sentiment leans slightly towards the bullish side, suggesting a balance between buying and selling pressures. This neutral sentiment implies a certain level of equilibrium in the market, with neither buyers nor sellers dominating the direction of price movement. Similar to other cryptocurrencies, Shiba Inu is also trading above its 20-day Simple Moving Average, which typically signals positive momentum in the short term.
Considering these factors, Shiba Inu appears to be demonstrating strong price performance in the current market environment. The notable price increase, coupled with a significant rise in trading volume, indicates growing investor interest and participation in SHIB. The neutral sentiment indicated by the RSI suggests a degree of stability in the market, with the potential for further price movement in the near term.