Why ADA Price Is Up Today?
NOIDA (CoinChapter.com)— Cardano’s ADA token’s price rose by more than 12% since May 1 to a daily high near $0.47 on May 3. The recent Federal Open Market Committee (FOMC) decision, along with some technical cues, could be the reason why ADA price is up today.
The Federal Reserve’s decision to hold interest rates constant likely helped the crypto sector, as the increased inflation data had investors worried that rate hikes would become popular once again.
Bullish Fractal Pattern Could Be Why ADA Price Is Up Today
A deep dive into ADA’s price action reveals a compelling story told through fractal technical analysis. Historically, ADA has exhibited fractal patterns, where past price actions seem to repeat or rhyme over time.
Currently, the Cardano token shows a fractal pattern that closely mirrors its previous bullish phases. Initially, a significant downtrend was observed, followed by a stabilization period and an impressive upward trend.

This fractal analysis suggests that ADA may be entering, or getting ready to enter, another bullish phase, similar to past cycles.
Moreover, the pattern indicates a potential for sustained growth, as it appears ADA is mimicking its historical price behavior, which previously led to substantial gains. The technical perspective provides a strong foundation for bullish sentiment among investors, encouraging more robust market participation.

Another bullish cue helping the ADA price go up today could be the ascending parallel channel that the Cardano token has painted. ADA prices are currently testing the pattern’s support trendline.
A rebound from here would bring ADA price to the pattern’s resistance trendline, helping the token reach $0.75, a jump of nearly 60% from current levels.
Interpretation of Active Supply and Distribution ChartsActive Supply Data
The active supply charts for ADA, spanning one to four years, reveal a decrease in the number of tokens actively transacted. This reduction in active supply typically suggests a strong holding pattern among investors, indicative of bullish sentiment.

It reflects confidence in ADA’s long-term value, leading to a decrease in market liquidity but potentially higher price volatility and increases as fewer tokens are available for trading
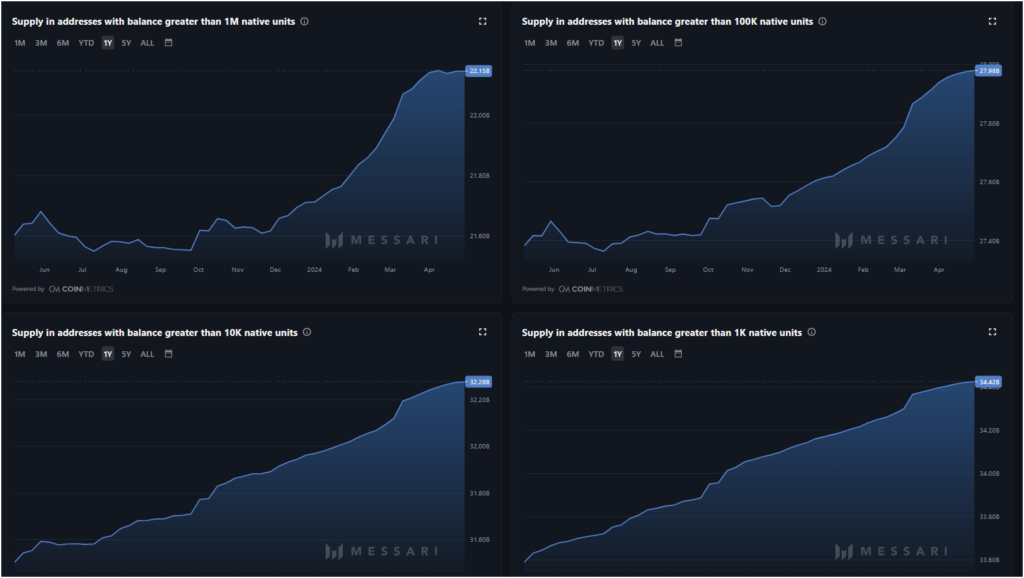
Further bullish signals are evident from the supply distribution data. There has been a noticeable increase in ADA holdings across addresses with substantial balances (ranging from 1,000 to over 1 million ADA).

This trend indicates that both large and small investors are accumulating ADA and are likely optimistic about future price appreciation. Such accumulation reduces sell pressure, which can naturally drive the price upwards as the available supply tightens.
Hence, a confluence of factors resulted in ADA price going up today. The FOMC’s recent decisions have set a macroeconomic context that influences digital asset valuations.
Simultaneously, technical analysis and market activity around ADA suggest a strong bullish trend underpinned by fractal analysis and significant changes in token distribution and active supply.
These elements combine to paint a positive outlook for ADA, driving its price upward as investor confidence grows and market participation increases.
The post Why ADA Price Is Up Today? appeared first on CoinChapter.