Shiba Inu Token Sees Price Increase and Market Cap Growth Amid Decline in Burn Rate
The Shiba Inu token ($SHIB) had experienced a notable uptick in its market value, with its price climbing 4.83% in the past 24 hours to $0.00002289, despite a slight decline of 0.83% over the last hour. The cryptocurrency’s market capitalization has risen by 4.89%, reaching $13.5 billion. The total supply of Shiba Inu tokens remains vast at approximately 589 trillion.
In contrast to the positive movement in market price and cap, the rate at which Shiba Inu tokens are being burned (permanently removed from circulation) has significantly slowed down. In the past hour, only 15,761 tokens were burned in a single transaction. Over the last 24 hours, 2.6 million tokens were burned, marking a decrease of 0.3%. This reduction becomes more pronounced when looking at the weekly data, where there’s an 85.51% plummet in the number of tokens burned, totaling about 64.7 million.
The slowing burn rate may have varying implications for the token’s future value and scarcity. Token burns are typically used in the cryptocurrency market to reduce supply and potentially increase the value of remaining tokens. The recent slowdown in burn activity could influence investor expectations and market dynamics in the short to medium term.
How Is Shiba Inu Doing Today?
Analysing Shiba Inu price charts, we see that the price has shown significant volatility as depicted by the width of the Bollinger Bands. Initially, there was a sharp drop in price, causing the bands to widen significantly, indicating high volatility. After the steep fall, the price has stabilized somewhat and is currently trading near the lower band, suggesting that the price is relatively low compared to recent averages. This could potentially indicate a buying opportunity if other indicators align.
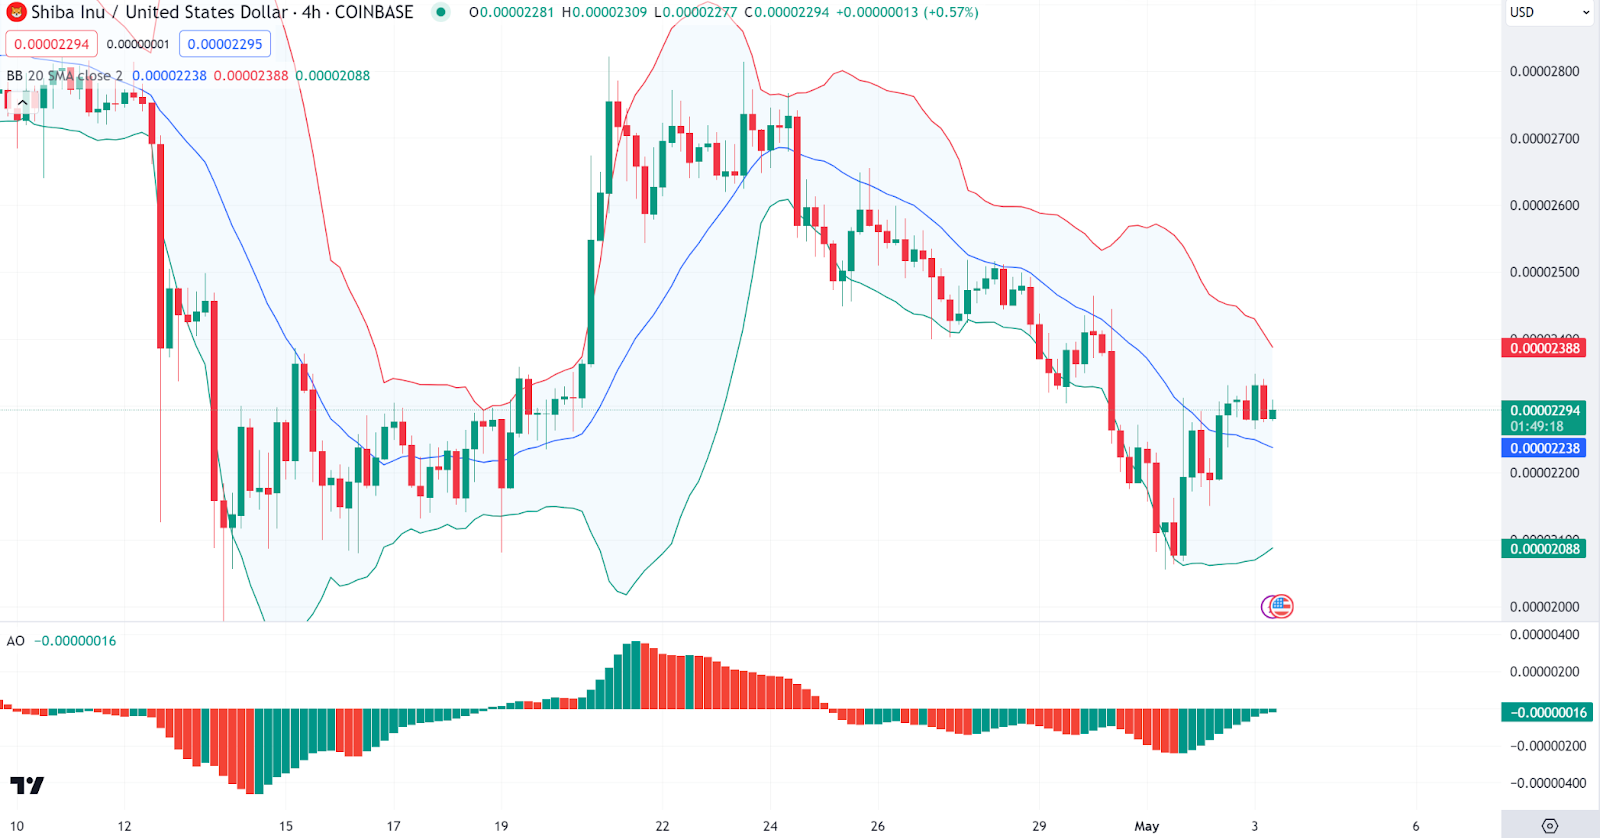
Looking at indicators, the Awesome Oscillator (AO) shows increasing green bars below the zero line, which indicates that bearish momentum is decreasing and could be shifting towards bullish momentum. This change aligns with the recent price recovery and suggests a possible continuation of the upward movement. The price is currently attempting to break above the middle Bollinger Band (20 SMA), which often acts as a dynamic resistance level. A sustained break above this could further validate the bullish sentiment.