Blockchain Report: Monthly Trends and Market Analysis
The post Blockchain Report: Monthly Trends and Market Analysis appeared first on Coinpedia Fintech News
Welcome to our monthly Blockchain Report! This edition delves into the general performance of various blockchains, spotlighting Total Value Locked (TVL), dominance, and 30-day TVL movement. Additionally, our Comparative Analysis section scrutinises top blockchains based on economic activity, development and innovation, market performance and stability, and adoption and user interest. Join us as we navigate through the intricate web of blockchain metrics, providing valuable insights into the evolving landscape of decentralised technologies.
1. Blockchain Performance: A General Analysis
A primary analysis of the performance of a blockchain for a particular month can be done using Total Value Locked.
Total Value Locked in a blockchain’s decentralised finance ecosystem reflects the aggregate value of assets locked in smart contracts. A rising TVL indicates adoption, economic activity, and user trust, suggesting a positive month of robust DeFi participation, enhancing the overall performance of the blockchain.
1.1. Blockchain Performance Analysis Using TVL and Dominance
Here are the top ten blockchains based on the overall TVL and Dominance data:
| No. | Blockchain | Dominance | TVL |
| 1 | Ethereum | 61.82% | $55,067,039,877 |
| 2 | TRON | 9.73% | $8,665,587,202 |
| 3 | BNB Smart Chain | 7.38% | $6,577,543,196 |
| 4 | Solana | 4.59% | $4,086,911,636 |
| 5 | Arbitrum One | 3.05% | $2,720,785,338 |
| 6 | Base | 1.84% | $1,641,804,457 |
| 7 | Blast | 1.66% | $1,481,634,198 |
| 8 | Bitcoin | 1.34% | $1,192,483,301 |
| 9 | Avalanche | 1.14% | $1,015,447,391 |
| 10 | Polygon POS | 1.08% | $960,697,484 |
| Others | 6.37% |
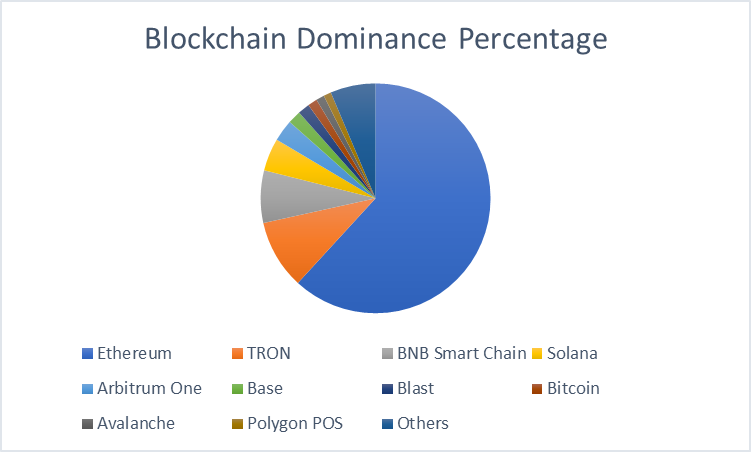
Ethereum, TRON, BNB Smart Chain, Solana, Arbitrum One, Base, Blast, Bitcoin, Avalanche and Polygon POS are the top ten blockchains on the basis of TVL.
As per the analysis, Ethereum dominates with 61.82%. TRON and BSC Smart Chain follow with 9.73% and 7.38%, respectively. Solana, with 4.59%, and Arbitrum One, with 3.05%, remain in the fourth and fifth positions, respectively. The dominance per cent of every other blockchain is less than 2%.
Ethereum registers a TVL of $55,067,039,877. TRON and BNB Smart Chain records TVLs of $8,665,587,202 and $6,577,543,196, respectively.
Notably, compared to the previous month’s dominance per cent, this month, the dominance value of Ethereum has increased from 56.7% to 61.82%. Conversely, the same value of Tron has slightly slipped from 10.7% to 9.73%.
1.1.1. Analysing Top Blockchains Using 30-Day TVL Movement
Let’s analyse the top blockchains with highest TVLs using the 1-month change data, to know how much movement the top chains have witnessed in the last 30 days.
| No. | Blockchain | 30-Day Change (in %) |
| 1 | Ethereum | +2.4% |
| 2 | TRON | -10.8% |
| 3 | BNB Smart Chain | +6.7% |
| 4 | Solana | -8.6% |
| 5 | Arbitrum One | -32.4% |
| 6 | Base | +88.7% |
| 7 | Blast | +39.7% |
| 8 | Bitcoin | N/A |
| 9 | Avalanche | -18.0% |
| 10 | Polygon POS | -10.3% |
As per the analysis, among the top blockchains, Base marks the highest positive 30-day change of +88.7%. Blast follows with +39.7%. BNB Smart Chain and Ethereum record +6.7% and +2.4%, respectively. Meanwhile, Arbiturm One is the one which registers the highest negative 30-day change of -32.4%. Avalanche, Tron and Polygon POS follow with -18.0%, -10.8% and -10.3%, respectively.
Last month, Solana was the one which recorded the highest 30-day change of +99.55%. This time, it displays a negative 30-day change of -8.6%.
1.2. Most Active Blockchains This Month By 30-Day TVL Movement
Let’s analyse what are the most active blockchains of this month. We can use the 30-day TVL movement indicator to do this analysis. For this, here we consider all the blockchains irrespective of their TVL strength.
| No. | Blockchain | 30-Day Change (in %) |
| 1 | Chiliz | +2050.1% |
| 2 | Core | +236.3% |
| 3 | Linea | +188.9% |
| 4 | Base | +88.7% |
| 5 | Blast | +39.7% |
| 6 | opBNB | +39.7% |
| 7 | Scroll | +17.3% |
| 8 | Mantle | +14.5% |
| 9 | Near Protocol | +8.5% |
| 10 | BNB Smart Chain | +6.7% |
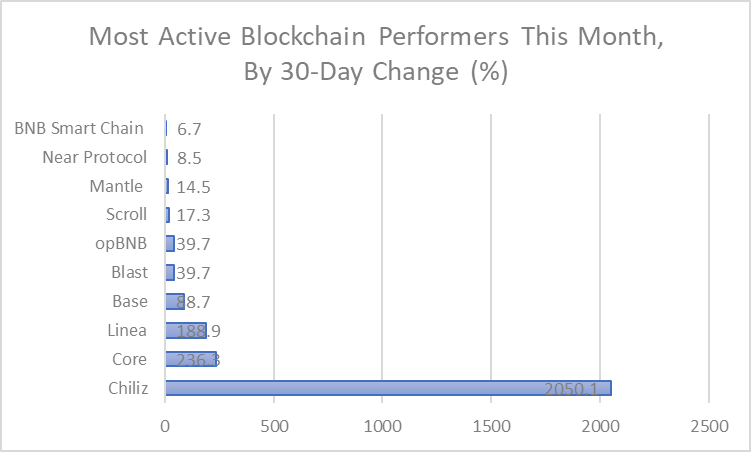
Chiliz, Core, Linea, Base, Blast, opBNB, Scroll, Mantle, Near Protocol and BNB Smart Chains are the ten most active blockchain of the month based on 30-day change.
Chiliz reports a 30-day change of +2050.1%. Core and Linea follow with +236.3% and +188.9%. Base records a change of +88.7%, and Blast and opBNB display changes of +39.7% and +39.7%, respectively. The change value of every other blockchain is less than 20%.
Last month, StarkNet, Solana, Base, Aptos and Sei Network were the five most active blockchains based on the 30-day change index. This time, only Base has a position in the top five list. Its one-month change per cent has been raised from +77.3% to +88.7%.
2. Blockchain Comparative Analysis: How Top Blockchains Performed This Month
By focusing on four aspects, you can gain insights into the economic strength, development activity, market stability, and adoption potential of each blockchain.
2.1. Blockchain Analysis: Total Value Locked and Economic Activity
Let’s assess the economic activity within each blockchain’s ecosystem. A higher TVL, transaction volume, and revenue may indicate a more vibrant and utilised blockchain.
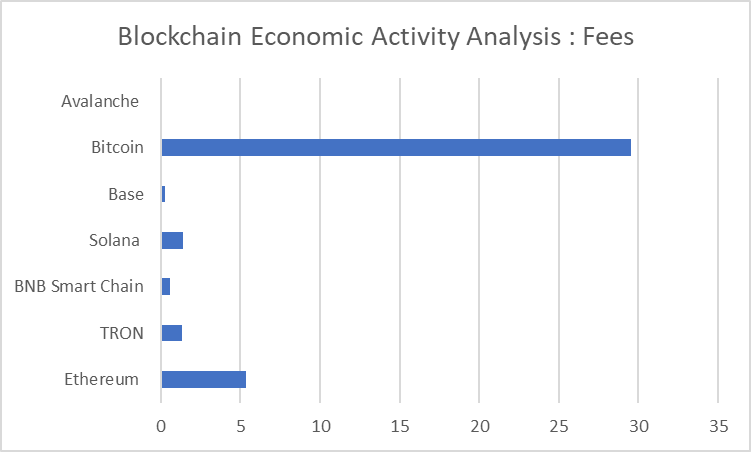
| Blockchains | Revenue | Fees | Volume | TVL |
| Ethereum | $4.09M | $5.35M | $1.689B | $55,067,039,877 |
| TRON | $1.31M | $1.31M | $28.5M | $8,665,587,202 |
| BNB Smart Chain | $59,105 | $591,054 | $650.78M | $6,577,543,196 |
| Solana | $706,364 | $1.41M | $1.493B | $4,086,911,636 |
| Arbitrum One | N/A | N/A | $476.05M | $2,720,785,338 |
| Base | $292,095 | $292,826 | $289.61M | $1,641,804,457 |
| Blast | N/A | N/A | $9.12M | $1,481,634,198 |
| Bitcoin | N/A | $29.56M | $347,100 | $1,192,483,301 |
| Avalanche | $40,922 | $40,002 | $58.87M | $1,015,447,391 |
| Polygon POS | N/A | N/A | $92.6M | $960,697,484 |
Among the top ten blockchains, Ethereum displays the highest TVL of $55,067,039,877, TRON and BNB Smart Chain follow with $8,665,587,202, and $6,577,543,196, respectively. Solana registers a TVL of $4,086,911,636, and Arbitrum One records a TVL of $2,720,785,338.
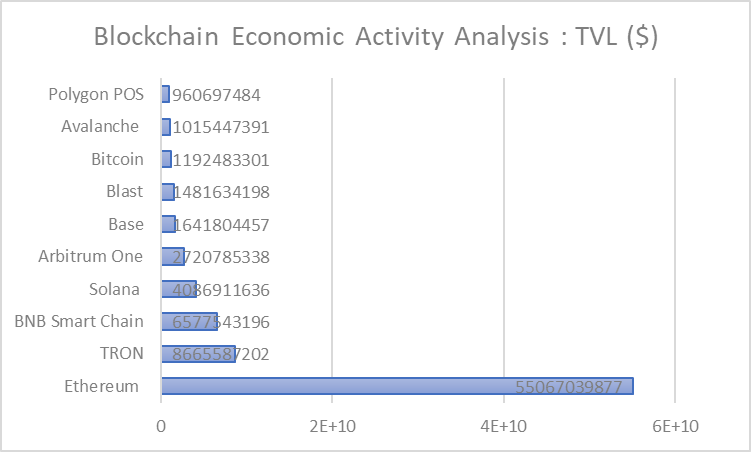
Ethereum shows the highest volume of $1.689B. Solana closely follows with $1.493B. BNB Smart Chain, Arbitrum One and Base record $650.78M, $476.05M, and $289.61M, respectively.

Bitcoin marks the highest fees of $29.56M. Ethereum showcases $5.35M fees. Solana and TRON exhibit $1.41M and $1.31M, respectively.
Ethereum reports the highest revenue of $4.09M, as per the available data. Tron follows closely with $1.31M. Solana and Base record $706,364 and $292,095, respectively.
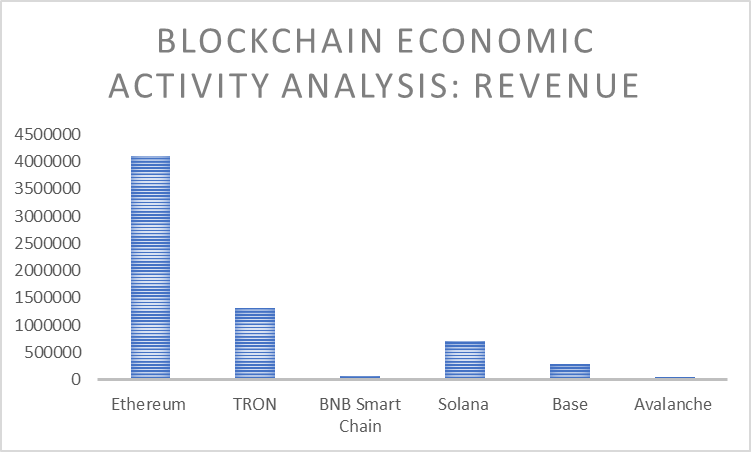
As per the analysis, Ethereum, Tron and Solana excels in terms of economic activity. BNB Smart Chain and Base also display good performance.
2.2. Blockchain Analysis: Development and Innovation
Let’s evaluate the development activity and innovation within each blockchain. A blockchain with a strong development community, active core developers, and a higher number of commits may suggest ongoing improvement and evolution.
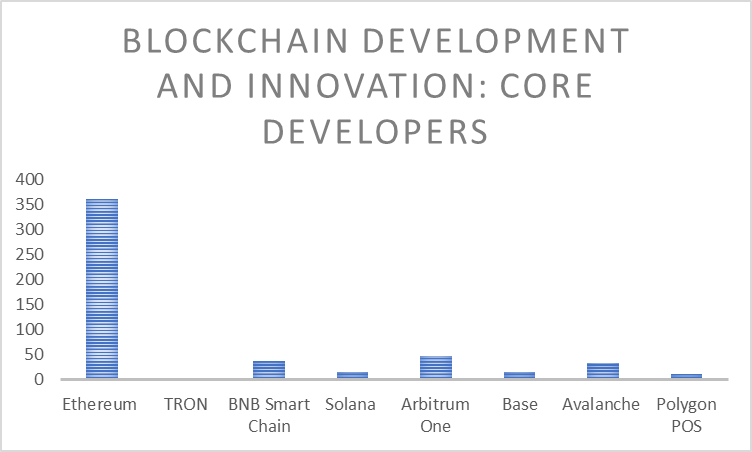
| Blockchains | Commits | Core Developers |
| Ethereum | 11.25K | 362 |
| TRON | 16 | 3 |
| BNB Smart Chain | 428 | 37 |
| Solana | 545 | 16 |
| Arbitrum One | 1.14K | 48 |
| Base | 101 | 16 |
| Blast | N/A | N/A |
| Bitcoin | N/A | N/A |
| Avalanche | 1.64K | 33 |
| Polygon POS | 158 | 12 |
Among the top ten blockchains, Ethereum presents the highest core developer index value of 362, far higher than its core competitors, Arbitrum One (48), BNB Smart Chain (37) and Avalanche (33). Solana and Base, both, mark 16.
Ethereum reports the highest commis index value of 11.25K. Avalanche and Arbitrum One closely follow with 1.64K and 1.14K, respectively. Solana exhibits 545 commits, and BNB Smart Chain displays 428 commits.
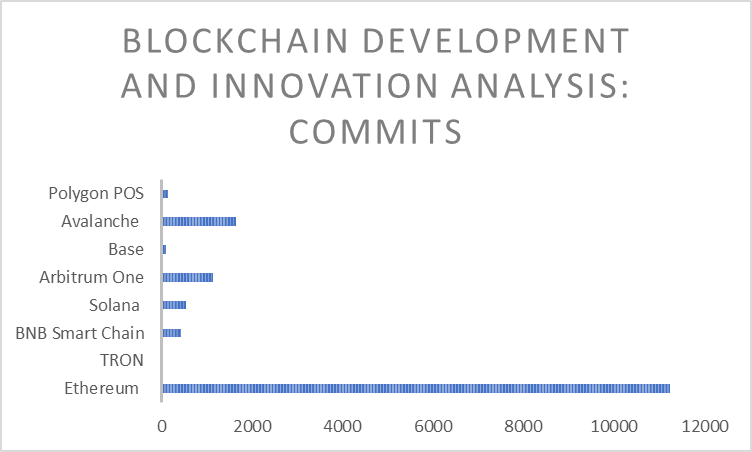
As per the blockchain development and innovation analysis, focusing both the commits and core developers indices, Ethereum performs better. Avalanche and Arbitrum One also demonstrate satisfactory performance.
2.3. Blockchain Analysis: Market Performance and Stability
Let’s analyse the market performance and stability of each blockchain’s native cryptocurrency. The prevalence and usage of stablecoins within the ecosystem can measure stability and potential as a medium of exchange.

| Blockchains | Price | Stablecoins Market Cap |
| Ethereum | $3,194 | $83.096B |
| TRON | $0.11 | $56.02B |
| BNB Smart Chain | N/A | $4.868B |
| Solana | $153.28 | $3.259B |
| Arbitrum One | $1.14 | $3.439B |
| Base | N/A | $127.55M |
| Blast | N/A | $337.99M |
| Bitcoin | $64,819 | N/A |
| Avalanche | $37.31 | $1.772B |
| Polygon POS | $0.72 | $1.584B |
As per the analysis, Ethereum, with $83.096B stablecoin market capitalisation and $3,194 price, exhibits impressive performance. Tron, with $56.02B stablecoin market capitalisation and $0.11 price, remains as the strongest competitor of Ethereum. BNB Smart Chain, Arbitrum One and Solana also demonstrate satisfactory performance. BNB Smart Chain’s stablecoin market cap is $4.868B.; Arbiturm One’s is $3.439B; and Solana’s is $3.259B.
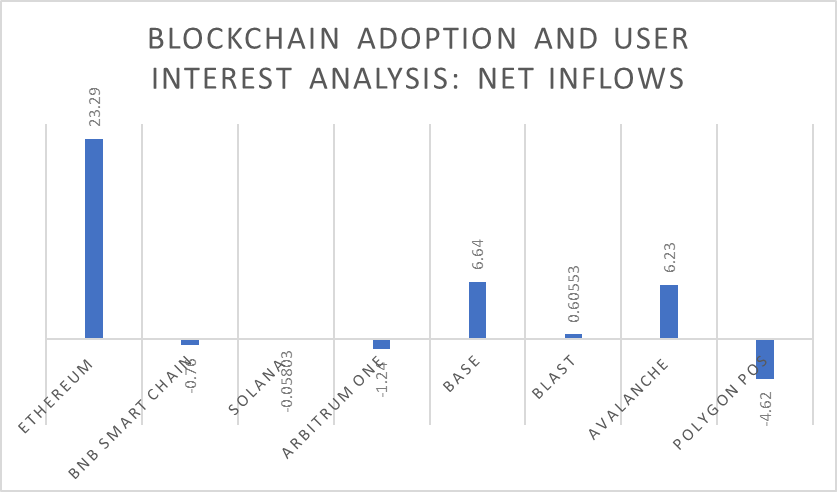
2.4. Blockchain Analysis: Adoption and User Interest
Let’s examine the level of adoption and user interest by looking at inflows, coin price and market capitalisation. A blockchain with increasing user interest and growing market capitalisation may indicate a higher level of adoption.
| Blockchains | Token Price | Token Market Cap | Net Inflows |
| Ethereum | $3,194 | $389.721B | $23.29M |
| TRON | $0.11 | $9.918B | N/A |
| BNB Smart Chain | N/A | N/A | -$0.76M |
| Solana | $153.28 | $68.879B | -$0.05803M |
| Arbitrum One | $1.14 | $3.033B | -$1.24M |
| Base | N/A | N/A | $6.64M |
| Blast | N/A | N/A | $0.60553M |
| Bitcoin | $64,819 | $1279B | N/A |
| Avalanche | $37.31 | $14.135B | $6.23M |
| Polygon POS | $0.72 | $6.706B | -$4.62M |
Among the top ten blockchains, Ethereum shows the highest net inflow of $23.29M. Base and Avalanche follow with $6.64M and $6.23M, respectively. Conversely, the highest negative net inflow is recorded by Polygon POS, which reports -$4.62M net inflow.
Bitcoin registers an impressive token market cap of $1279B. Etheruem follows with $389.721B.
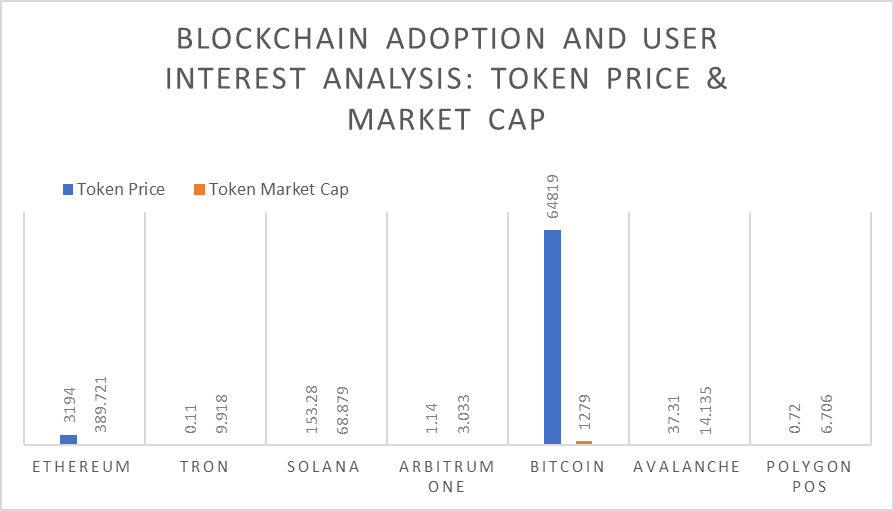
As per the blockchain adoption and user interest analysis done using the net fund flow and token market cap indices, Ethereum exhibits good performance. Bitcoin, Avalanche, and Base also display satisfactory performance.
Read Also : Stablecoin Performance and Analysis Update: An In-depth Monthly Report
Endnote
In conclusion, this monthly report serves as a compass for navigating the ever-changing terrain of blockchain technology. By examining key metrics such as TVL, dominance and 30-day TVL movement, we gain a deeper understanding of the performance dynamics within the blockchain ecosystem. Furthermore, our comparative analysis sheds light on the nuanced difference between top blockchains, offering valuable insights into economic activity, development, market performance, and adoption trends. As blockchain continues to redefine industries and shape the future of finance and technology, may this report serve as a valuable resource for stakeholders and enthusiasts alike.
Also Check Out : Decoding Growth: Bitcoin ETF Monthly Review and Analysis