Glassnode Examines Bitcoin’s Sideways Trend and Correction Strategies
As Bitcoin continues to trade sideways, market participants are focused on the prevalent selling across investor classes. On the other hand, the fresh Breakdown metric bundle is creating possibilities for calculating local market lows while it corrects. Bitcoin’s price after hitting an all-time high in March has stabilized mid-$60k says Glassnode.
US Spot ETF Momentum Shapes Bitcoin Prices, Glassnode Insights
Glassnode’s analysts have investigated whether the investor behavior index indicates distribution or accumulations odds. The Accumulation Trend Score will be used to quantify the second hit on the market’s high and low points after the post-FTX crash peak. However, market distribution, combined with rising geopolitical instability in the Middle East, has stimulated adjustment to $60.3k.

The current bull market gives ideas how US Spot ETF momentum occupies prices. The Net Unrealized Profit & Loss measures market sentiment, showing that a paper profit of half the market cap is a factor of euphoria. This cycle has NUPL recording 0.5 six and half months pre-halving to show the effect of ETFs. There have been euphoria phases in this bull market for the last 7 months.
Glassnode uses the conditions of Relative Unrealized Profit & Loss to provide a picture of the most common correction patterns as of the $73.1k ATH. Assurance is provided that the Euphoria zone is still intact, as it acknowledges expected corrections. The contraction occurs when the aggressive market side is established. The assumption that short-term holders lead the aggressive side is realized when checking the Realized Loss breakdown.

MVRV Ratio Highlights Market Corrections and Panic Losses
The cost basis of recent buyers is analyzed using the Glassnode Breakdown metric suite. A crucial cohort is the Short-Term Holders in Loss, which uses the Breakdown metric suite to analyze. The 1m-3m and 3m-6m cohorts offer market structures clues, with the 1w-1m cohort providing potential market inflection points.
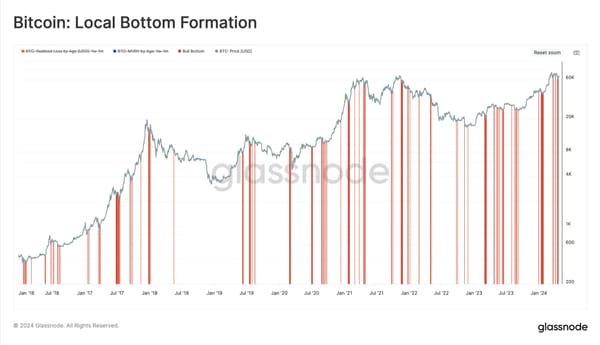
MVRV ratio profiles how far spot prices fall under 1w-1m cohort cost bases during corrections. MVRV ratio ranges for bull-market pullbacks fall within 0.9-1. Following the pressure on 1w-1m investors, panic losses are recorded as the realized loss.
Realized Loss 1w-1m defines aggressive selling. 1w-1m Entities’ Realized Loss USD identifies periods of high-loss realization intervals that exceed one standard deviation. With the price at $60k-$66.7k, MVRV condition implies the local bottom is established.
To sum up, with Bitcoin moving sideways, it is important for investors to know investor strategies during a correction and have strategies for such situations. The findings of Glassnode demonstrate ongoing sales during consolidation, and the Breakdown metric provides an overview of the selloff local markets.