Daily Market Review: BTC, ETH, HNT, W, ENA
Bears are still dormant in today’s session, as seen from the decrease in the global market cap. The total cap stood at $2.33T as of press time, representing a 2.14% decrease over the last 24 hours. The trading volume is also 23% up for the day, at $66.06B as of press time.
Bitcoin Price Review
Despite the general downtrend, Bitcoin (BTC) is among the gainers in today’s session. An in-depth analysis of *BTC* price charts shows that the Bollinger Bands are narrowing, indicating decreased volatility and a potential buildup for a significant price move. The Bitcoin price is currently above the 20-period SMA (Simple Moving Average), suggesting a bullish trend in the short term.
On the other hand, the MACD (Moving Average Convergence Divergence) is above the signal line, indicating bullish momentum. As of press time, the Bitcoin price stood at $63,442, representing a 1.3% decrease from its previous 24-hour price.

Ethereum Price Review
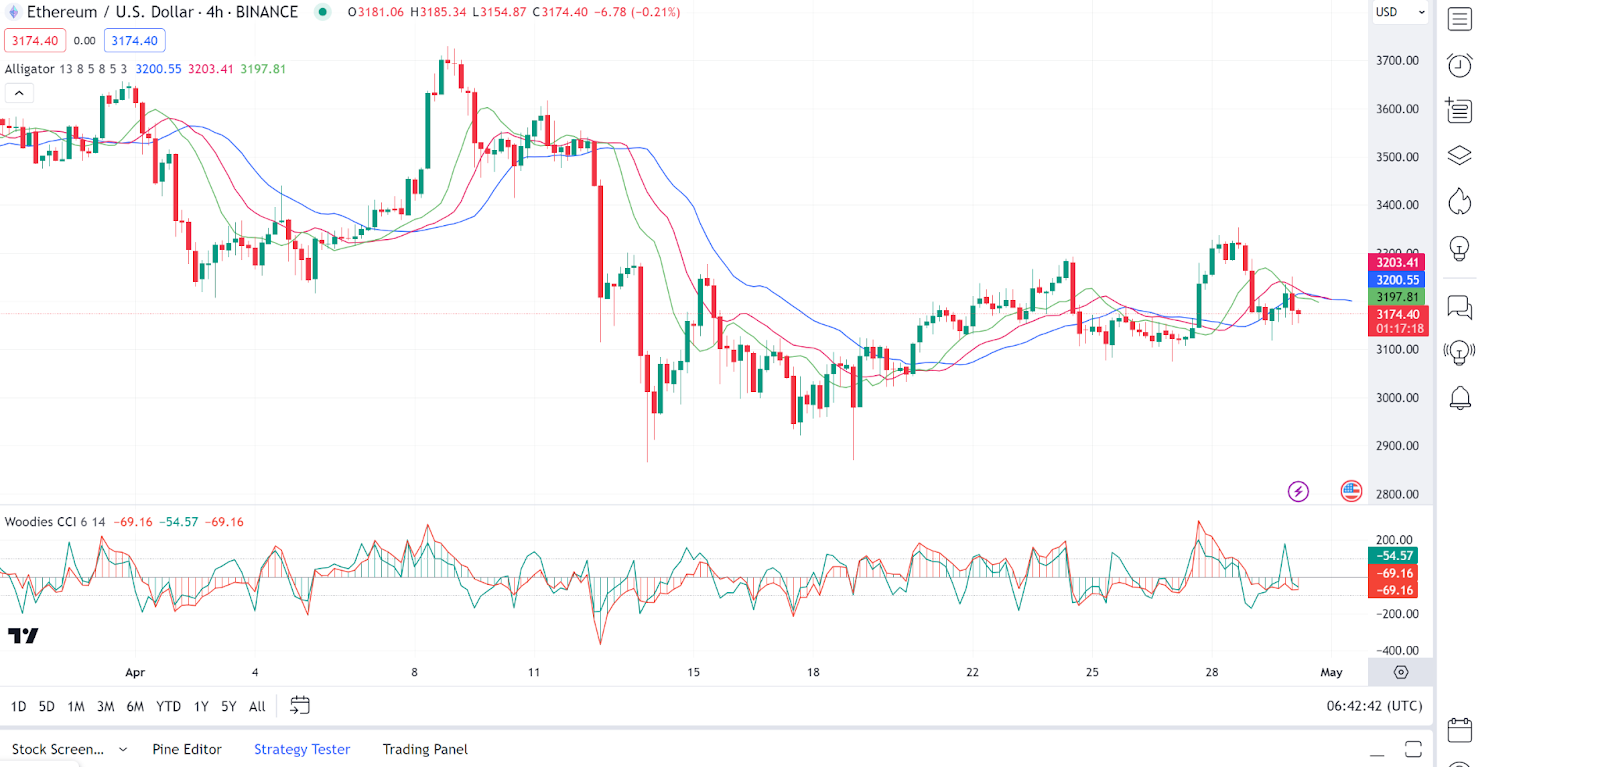
Ethereum (ETH) is facing consolidations in today’s session, as evidenced by its price movement. Analysing *ETH* price charts, we notice that the Alligator indicator suggests the market is currently in a consolidation phase, with the lines intertwined and flat.
Woodie’s CCI (Commodity Channel Index) lacks clear momentum, hovering around the zero line, indicating a sideways market. The Ethereum price is trading around the middle of the Alligator’s jaws, suggesting no clear trend. As of press time, the Ethereum price stood at $3,172, representing a 0.01% increase from its previous 24-hour price.
Helium Price Review
Helium (HNT) is today’s top gainer, as evidenced by its price movements during today’s session. Analysing Helium price charts, we see that the Supertrend indicator recently turned bullish, as seen by the green bar below the price, suggesting a potential uptrend. However, the recent Helium price action has entered a red cloud, indicating some resistance or a possible trend reversal.
On the other hand, the MFI (Money Flow Index) is in the overbought region, which can sometimes precede a price pullback. As of press time, the Helium price stood at $5.81, representing a 13.2% increase from its previous 24-hour price.

Wormhole Price Review
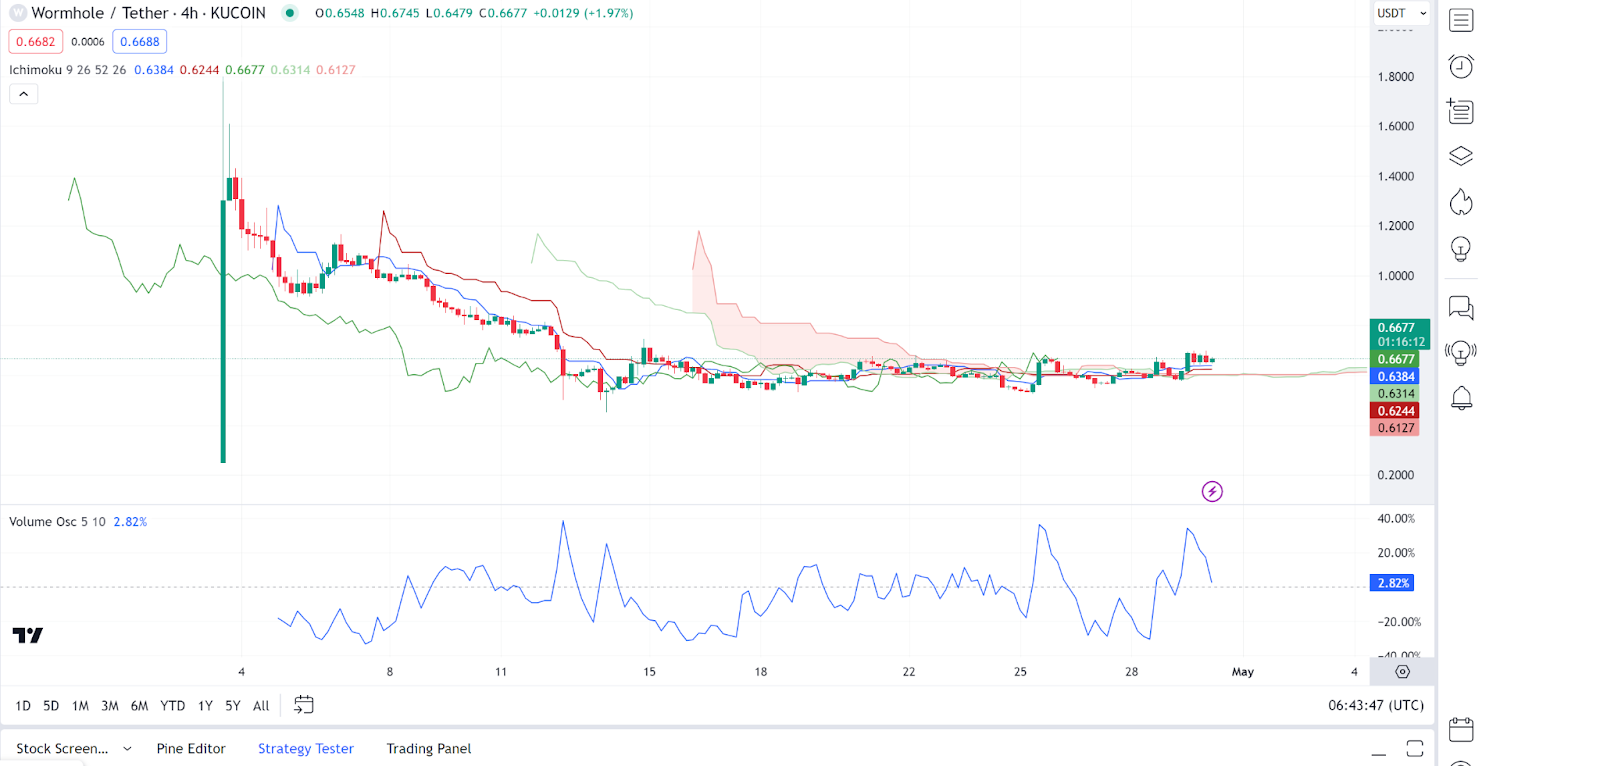
Wormhole (W) is another gainer in today’s session as seen from its recent price actions. Analysing Wormhole price charts, we see the Wormhole price trading within the Ichimoku Cloud, indicating uncertainty and a lack of clear direction. The Wormhole price has been oscillating around the Ichimoku Cloud, without a decisive breakout.
On the other hand, the Volume Oscillator doesn’t show any significant peaks, implying a moderate level of trading activity without central buying or selling pressure. As of press time, the Wormhole price stood at $0.6693, representing a 14.7% increase from its previous 24-hour price.
Ethena Price Review
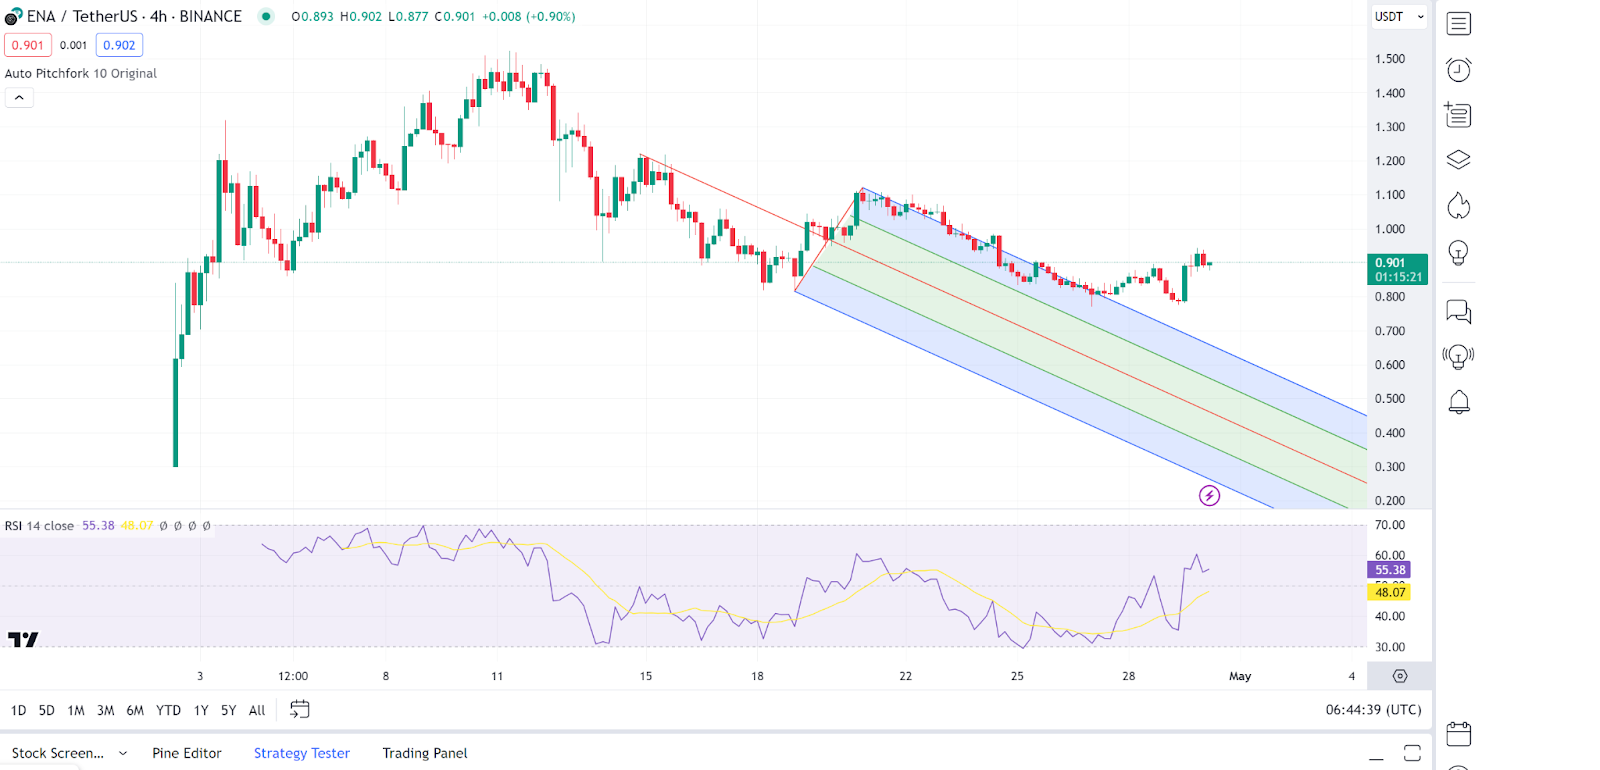
Ethena (ENA) is the other top gainer in today’s session, as seen from its price movements today. Looking at Ethena price charts, we see the Ethereum price is currently in the upper half of the pitchfork, indicating potential resistance if the price tries to move upward.
On the other hand, the RSI (Relative Strength Index) is near the 50 level, which doesn’t indicate a strong momentum in either direction. As of press time, the Ethena price stood at $0.9008, representing a 13.4% increase from its previous 24-hour price.