Daily Market Review: BTC, ETH, XRP, OP, STRK
Today’s market session saw bulls take over as seen from the global market cap increase. The total cap stood at $2.37T as of press time, representing a 1.8% increase over the last 24 hours, while the trading volume dropped by 10% to stand at $53.27B as of press time.
Bitcoin Price Review
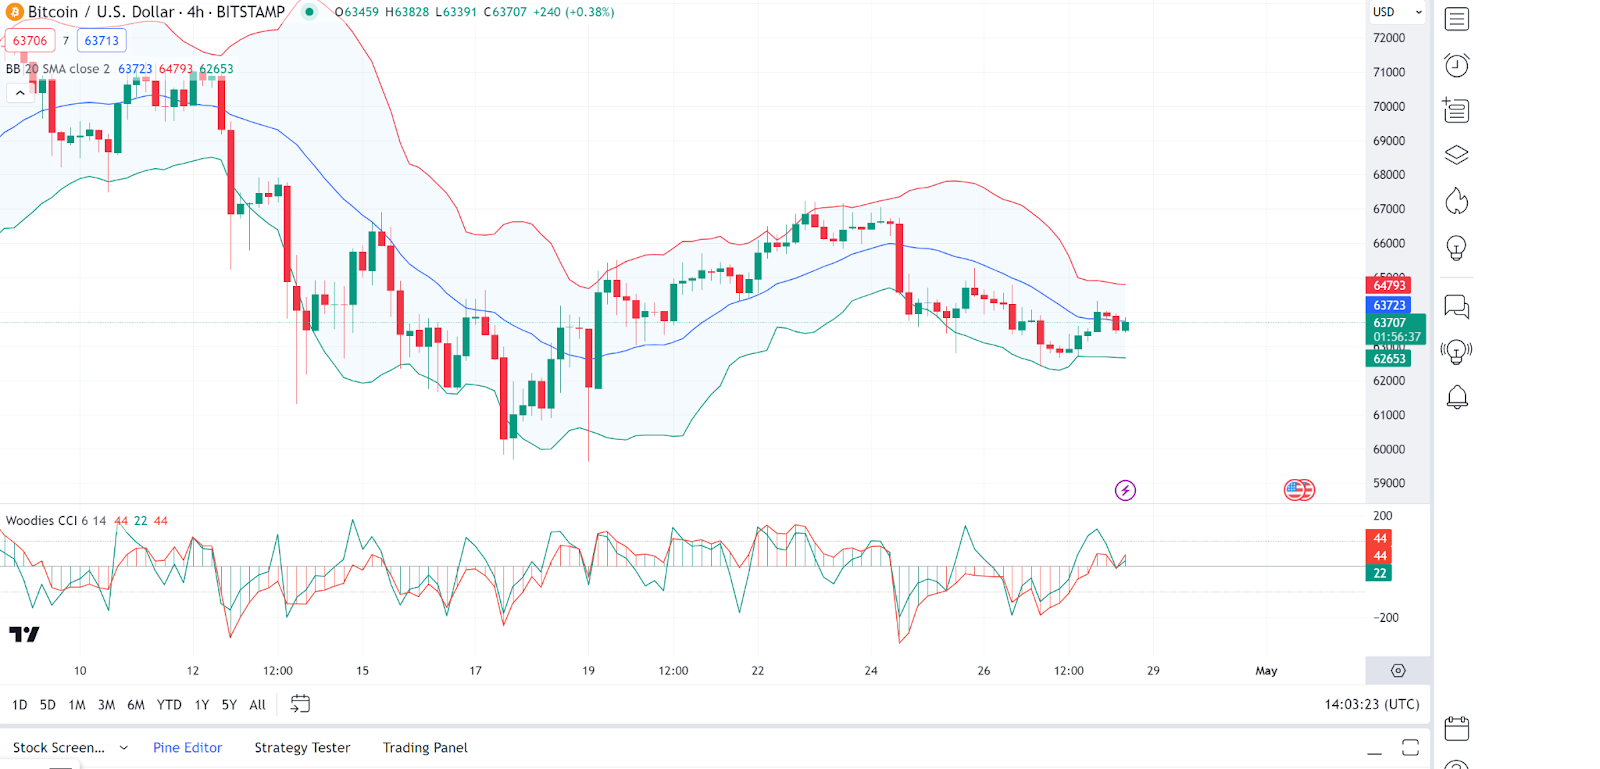
Bitcoin (BTC) is recovering as it registers a slight price increase. In-depth analysis shows that the Bollinger Bands are contracting, suggesting a decrease in volatility. The Bitcoin price is currently hovering around the middle Bollinger Band, indicating a need for a strong trend direction.
On the other hand, Woodie’s CCI is hovering around the zero line, which typically indicates a lack of solid momentum in either direction. The Bitcoin price has recently tested the upper Bollinger Band and was rejected, suggesting resistance at that level. As of press time, the Bitcoin price stood at $63,635, representing a 0.5% increase from its previous 24-hour price.
Ethereum Price Review
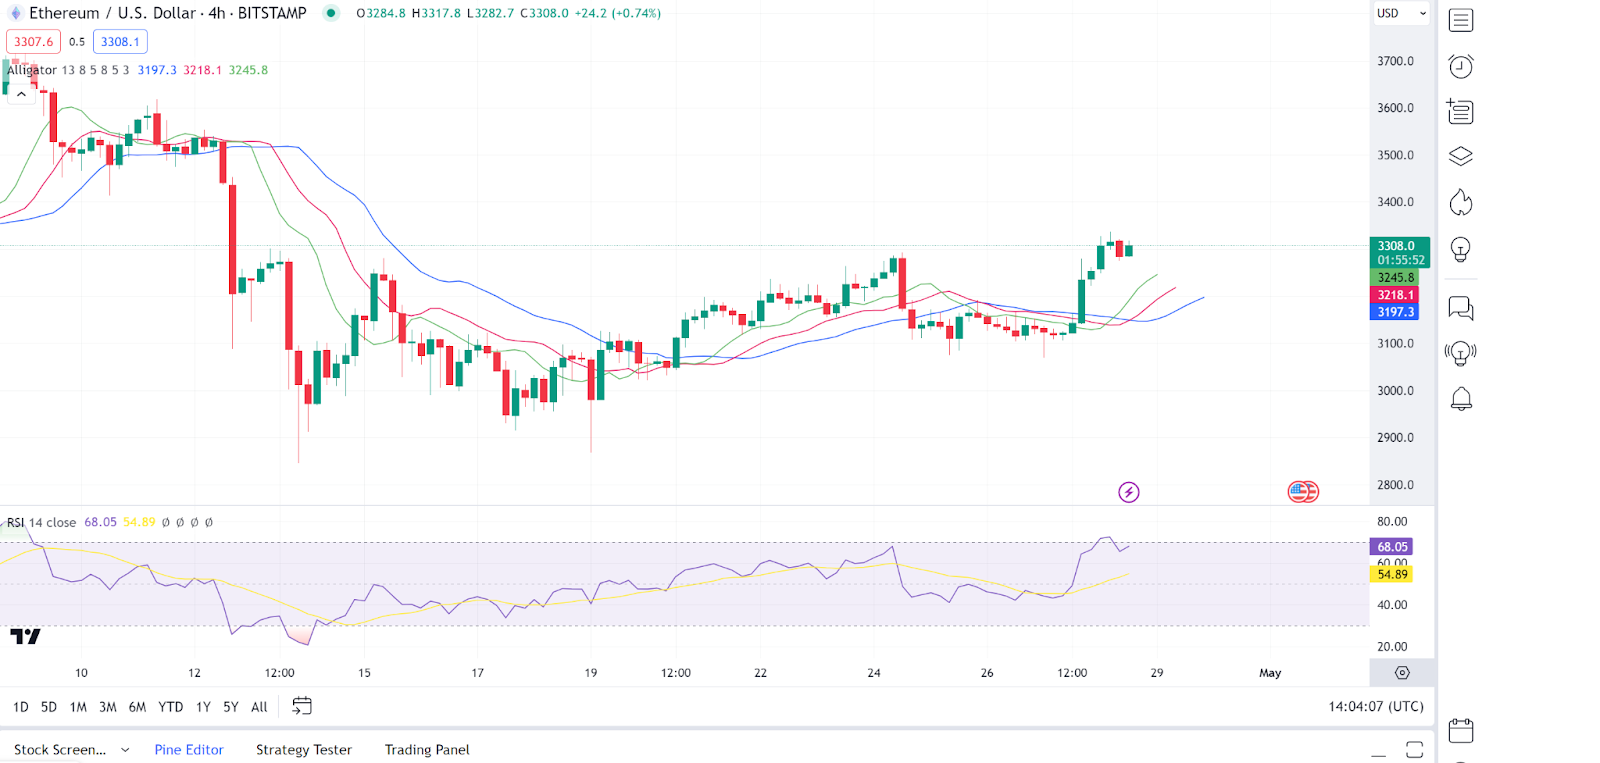
Ethereum (ETH) is also having a tremendous session today, as seen by its price movements. In-depth analysis shows that the alligator lines are intertwined and somewhat flat, indicating a ranging market without a clear trend.
On the other hand, the RSI is around the 55 level, which is neutral territory, not indicating overbought or oversold conditions. The Ethereum price of ETH is moving sideways, respecting the Alligator indicator’s lines as neither support nor resistance is clear. As of press time, the Ethereum price stood at $3,308, representing a 4.8% increase from its previous 24-hour price.
Ripple Price Review
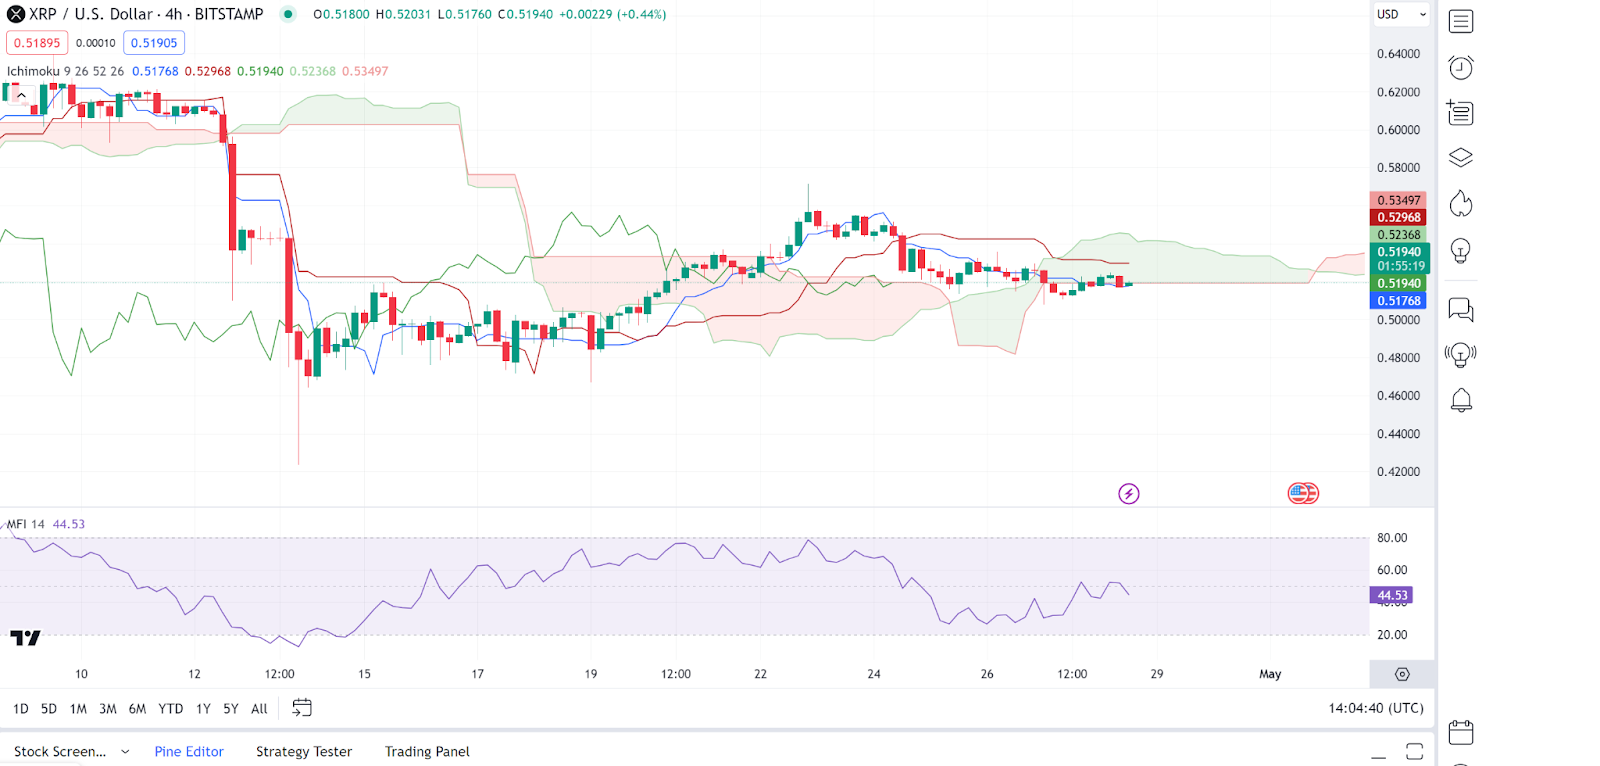
Ripple (XRP) has also managed to bounce back, as evidenced by its slight price increase. Looking at an in-depth analysis of Ripple price charts, we see that the Ripple price oscillates around the cloud, suggesting a lack of a strong trend. It’s currently slightly above the cloud, hinting at a potential uptrend.
On the other hand, the Money Flow Index (MFI) is roughly in the middle at 44.53, indicating neither overbought nor oversold conditions. The Ripple price shows a mix of red and green candles, with no clear direction. As of press time, the Ripple stood at $0.5188, representing a 0.2% increase from its previous 24-hour price.
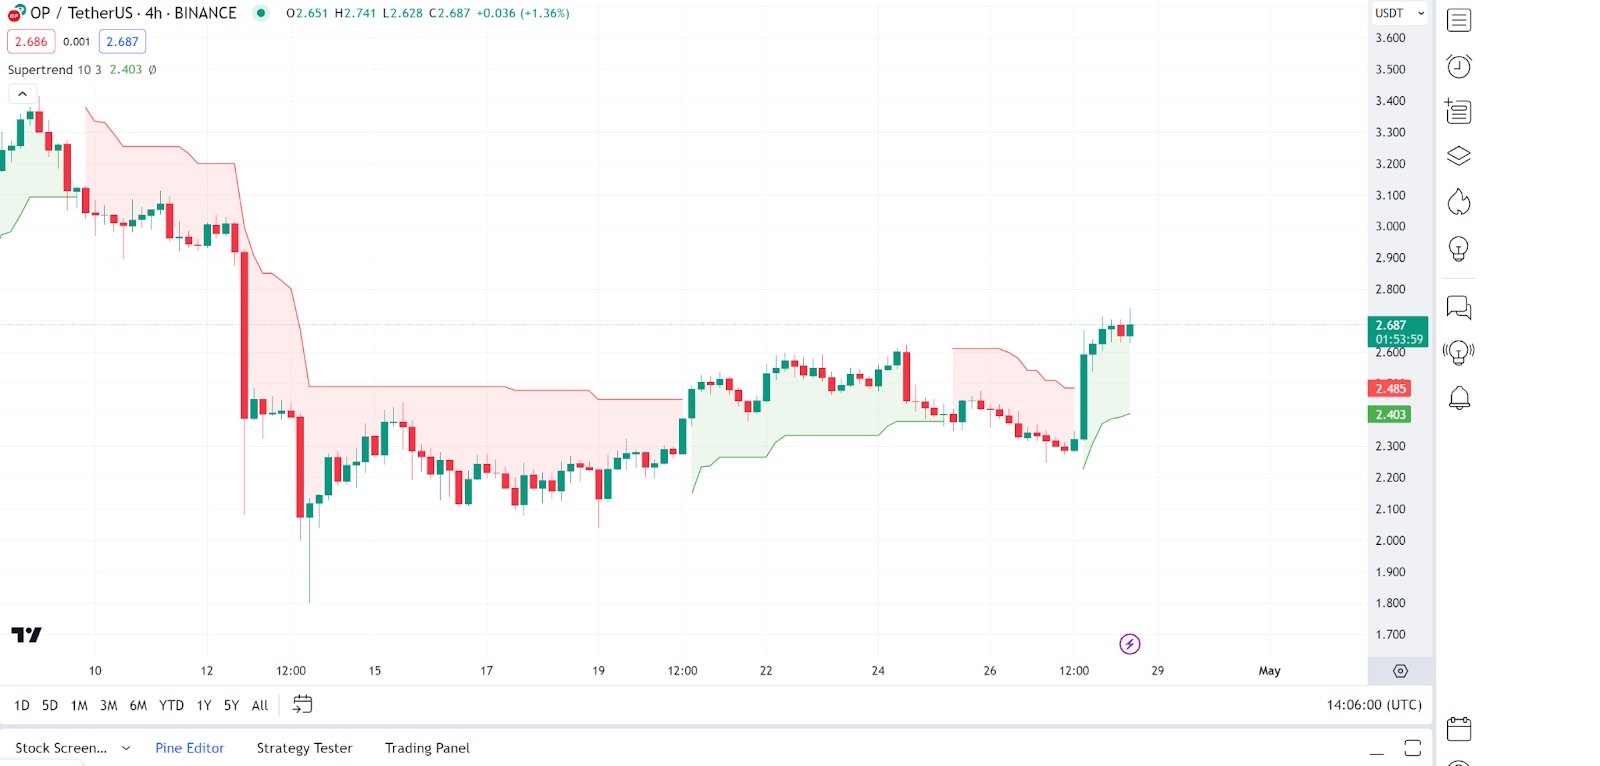
Optimism Price Review
Optimism (OP) is another gainer in today’s session, as evidenced by its impressive price action. An in-depth analysis shows that the recent switch from red to green suggests a potential change to an uptrend.
On the other hand, the Optimism price shows higher lows and higher highs, indicating bullish behavior. As of press time, the Optimism price stood at $2.69, representing a 15.7% increase from its previous 24-hour price.
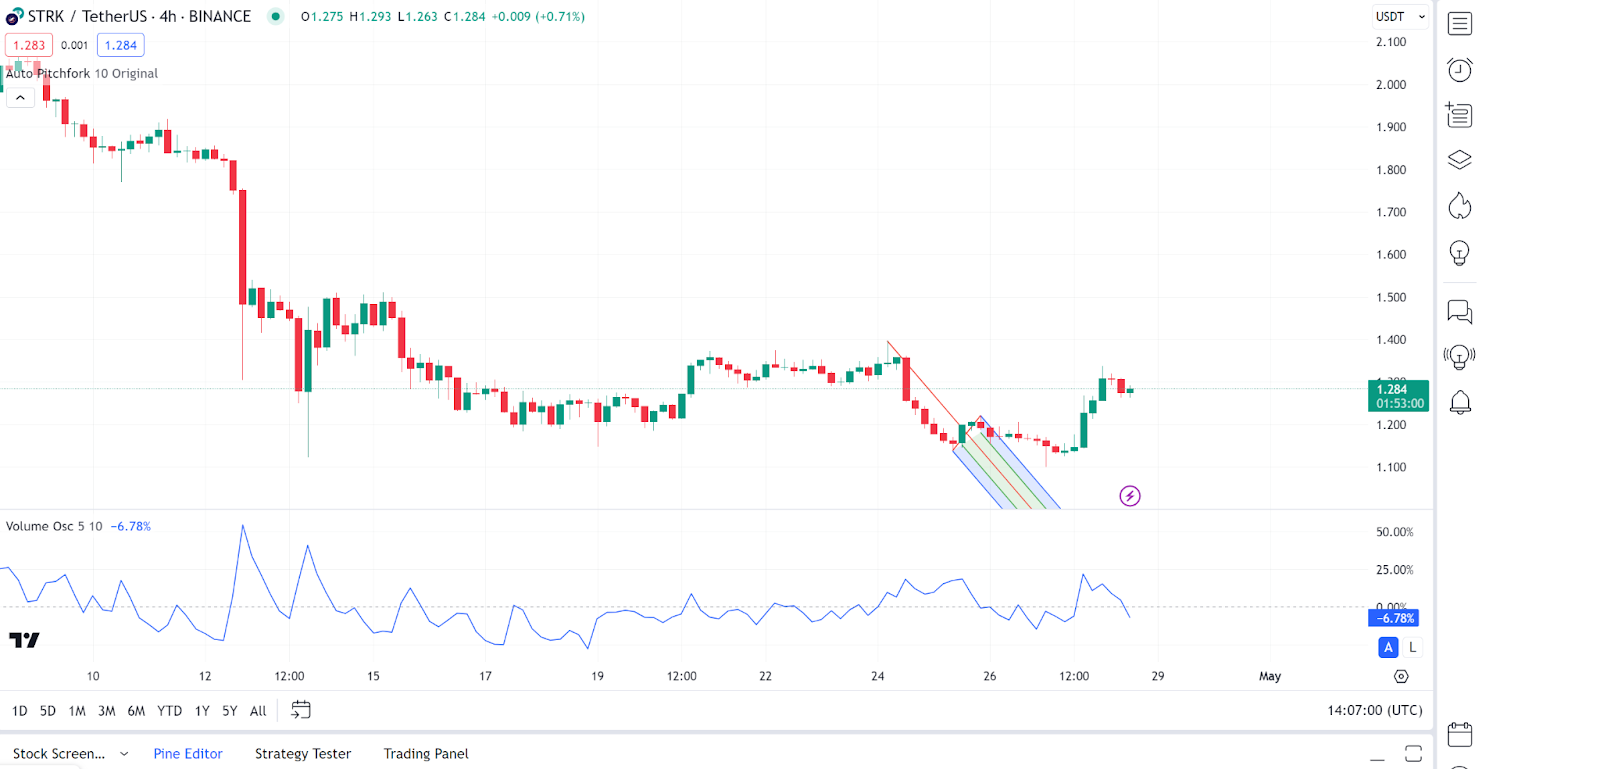
Starknet Price Review
Starknet (STRK) is another gainer in today’s session, as evidenced by its price movements. Looking at in-depth analysis, we notice that the chart includes an Auto Pitchfork, showing a price within the lower half and indicating a downtrend or consolidation phase.
Looking at momentum indicators, we see that the volume oscillator is negative, which could indicate less buying pressure and a continuation of the downtrend or range-bound conditions. The Starknet price has bounced off the lower Pitchfork line, suggesting some support at this level. As of press time, the Starknet price stood at $1.29, representing a 10.6% increase from its previous 24-hour price.