Daily Market Review: ETH, W, BONK, THETA, ICP
Bears still have the upper edge in today’s session, as evidenced by the drop in the global market cap. The total cap stood at $2.35 as of press time, representing a 4.49% decrease over the last 24 hours, while the trading volume jumped by 18% to $88.1B.
Ethereum Price Review
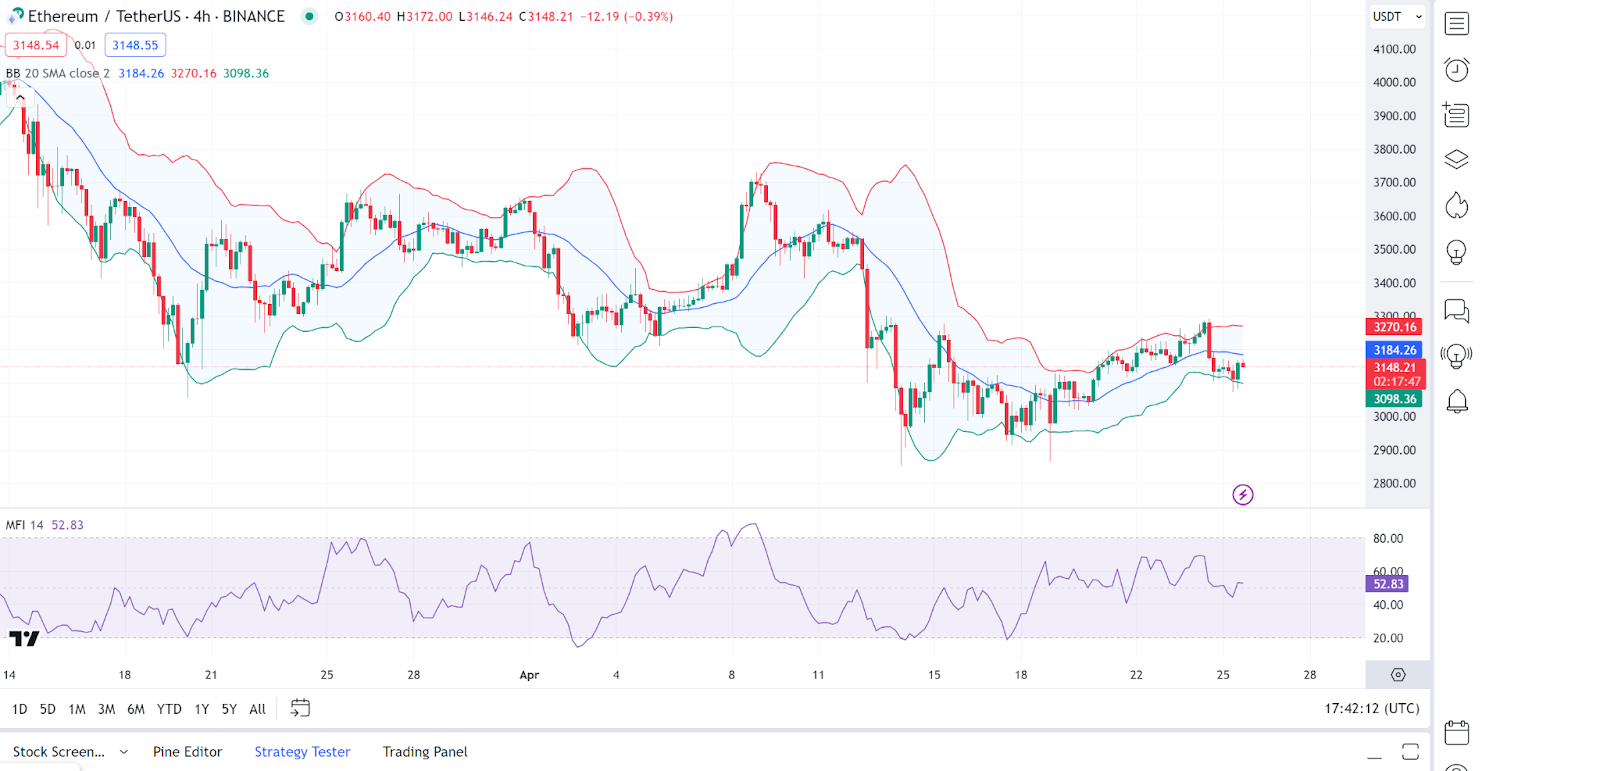
Ethereum (ETH) has fallen prey to the bear activity today as evidenced by its price drop over the last 24 hours. Looking at an in-depth analysis of *ETH* price charts, we notice that the Bollinger Bands are moderately wide, indicating a decent level of volatility in the price action.
On the other hand, the Money Flow Index (MFI) is at 52.83, which is in the middle range, indicating neither overbought nor oversold conditions. The Ethereum price is slightly below the middle Bollinger Band (20 SMA), suggesting a potential downtrend continuation unless it reverts above this moving average. As of press time, the Ethereum price stood at $3,161, representing a 0.4% increase from its previous 24-hour price.
Wormhole Price Review
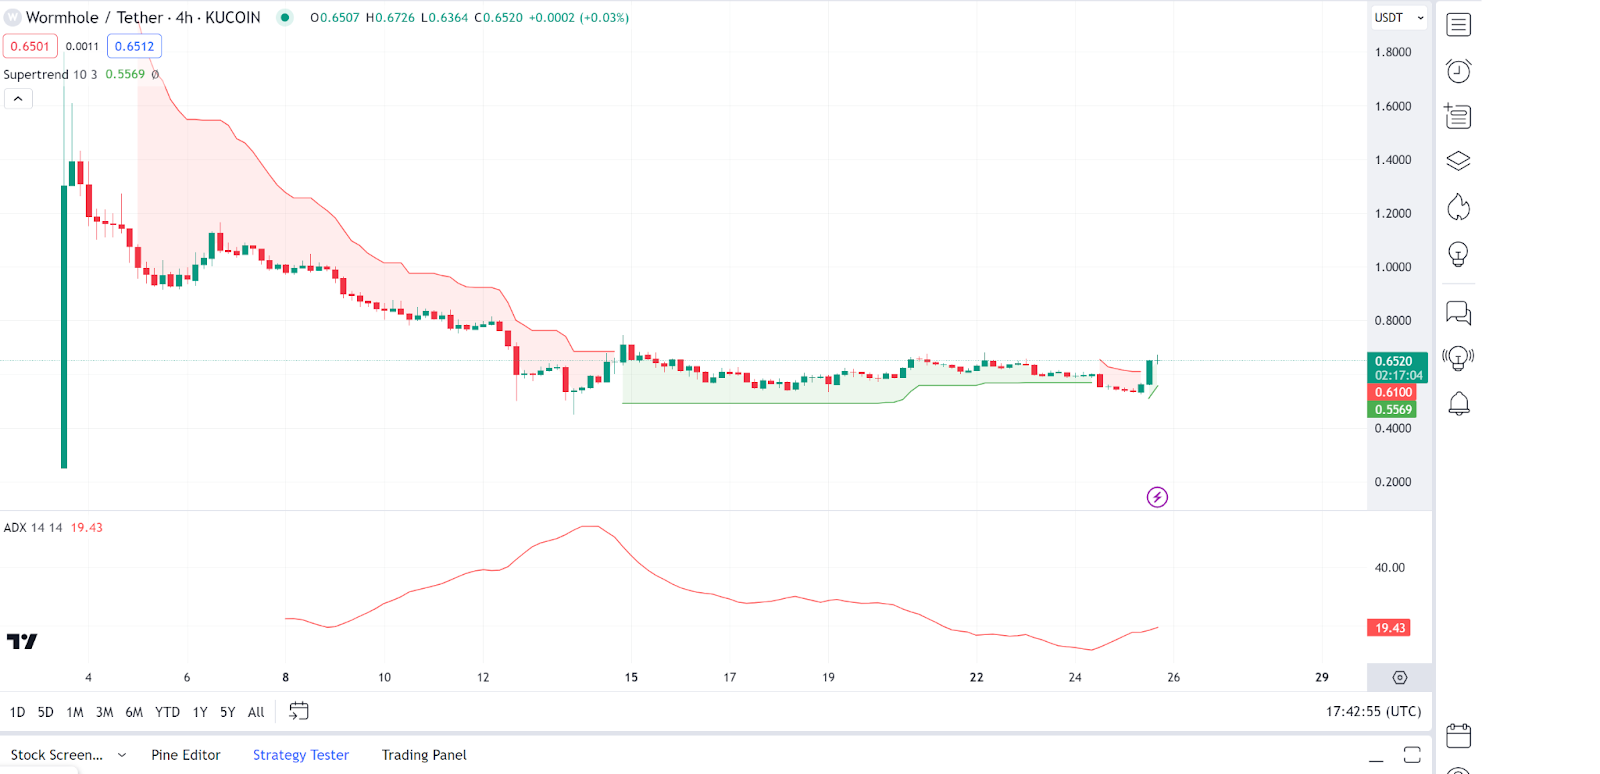
Wormhole (W) is among the few gainers today, as evidenced by its impressive movements. In-depth analysis shows that the SuperTrend indicator is above the Wormhole price and in red, signalling a bearish trend. The price is currently stable at around $0.650.
On the other hand, the Average Directional Index (ADX) is at 19.43, which suggests a weak trend. An ADX value below 25 indicates a lack of strong direction in price movement. As of press time, the Wormhole price stood at $0.6634, representing a 19.13% increase from its previous 24-hour price.
Bonk Price Review
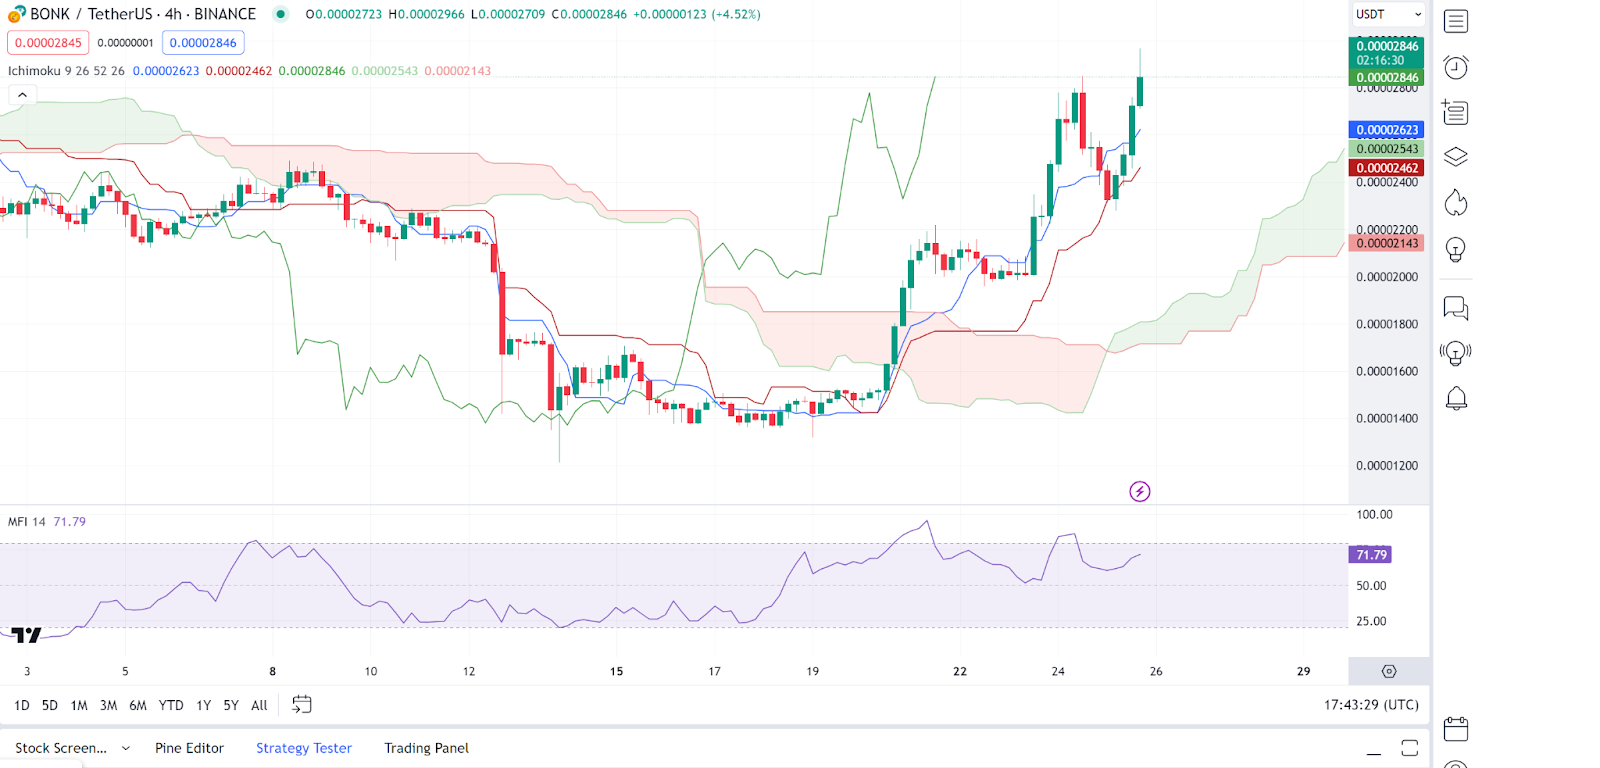
Bonk (BONK) is another gainer in today’s session despite the general bear market trend. Looking at in-depth analysis, we notice that the Ichimoku Cloud indicates a bullish trend with the Bonk price above the cloud.
Conversely, looking at other indicators, we notice that the Money Flow Index (MFI) is high at 71.79, suggesting that the asset might be approaching overbought territory. As of press time, the Bonk price stood at $0.00002882, representing a11.7% increase from its previous 24-hour price.
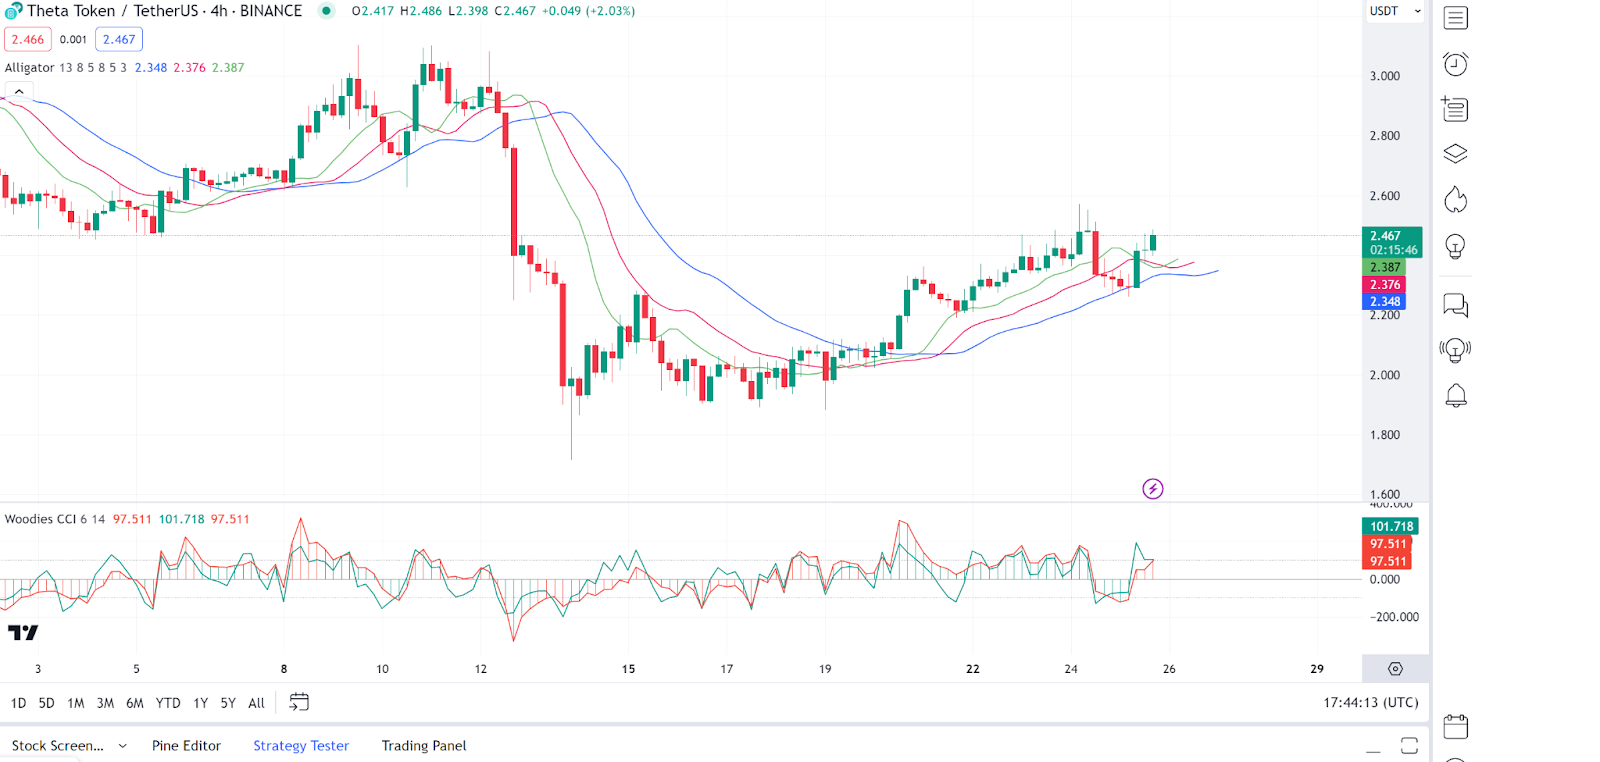
Theta Network Price Review
Theta Network (THETA) is another gainer in today’s session as it defied the bear wave. Looking at Theta Network price charts, we notice that the Alligator indicator shows the lines starting to interweave, which could mean the market is currently without a clear trend or maybe in consolidation.
On the other hand, gauging momentum, the Woodies CCI is close to the zero line, indicating a lack of strong momentum. During writing, the Theta Network price stood at $2.49 representing a 5% increase from its previous 24-hour price.
Internet Computer Price Review
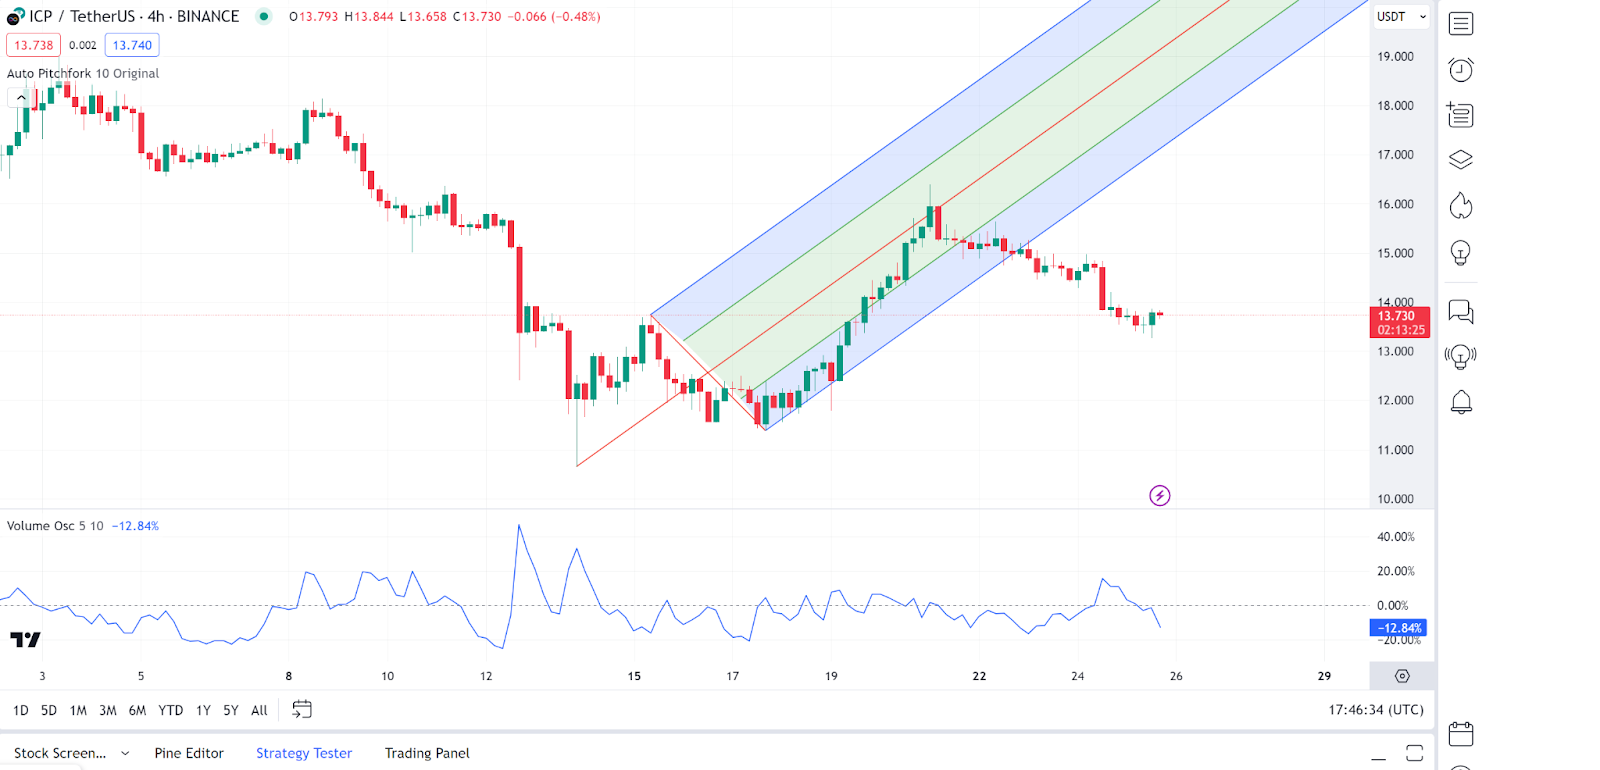
Internet Computer (ICP) has, however, fallen prey to the bear action as it fails to post gains in the current session. Looking at an in-depth analysis of Internet Computer price charts, we notice that the Auto Pitchfork shows the Internet Computer price in the upper half of the pitchfork, indicating a bullish bias. However, some resistance is currently being faced.
On the other hand, the Volume Oscillator is at -12.84%, which means that volume decreases on down moves, possibly signalling less conviction in the downward price movement. During writing, the Internet Computer price stood at $13.77, representing a 1.3% decrease from its previous 24-hour price.