PEPE Price Prediction – This Bullish Pattern Could Trigger Massive Surge
Key Takeaways:
- PEPE price gained over 50% in the last seven days and traded above $0.0000070.
- It is following a crucial bullish flag pattern with resistance at $0.00000790 on the daily chart.
- The price could rally further if there is a close above the 50-day simple moving average (blue) and $0.0000080.
NEW DELHI (CoinChapter.com) — PEPE price started another increase from $0.0000042. It is now facing an important breakout resistance at $0.0000078 and $0.0000080.
PEPE Price Eyes Breakout
After struggling to stay above the $0.000010 level in March 2024, PEPE price started a downside correction, like Bitcoin and Ethereum. There was a move below the $0.0000080 and $0.0000065 support levels. The price even broke the $0.0000050 support.
A low was formed at $0.00000417 before the price started a bullish wave. Recently, Coinbase launched PEPE perpetual futures. It sparked a sharp buying interest and pushed the price higher.
Our 1000PEPE-PERP market is now in full-trading mode on Coinbase International Exchange and Coinbase Advanced. Limit, market, stop, and stop limit orders are all now available. pic.twitter.com/hO32wARVFu
— Coinbase International Exchange(@CoinbaseIntExch) April 23, 2024
In the past seven days, PEPE gained over 50% and broke many hurdles near the $0.0000060 resistance. The bulls even pushed the price above the 50-day simple moving average (blue).
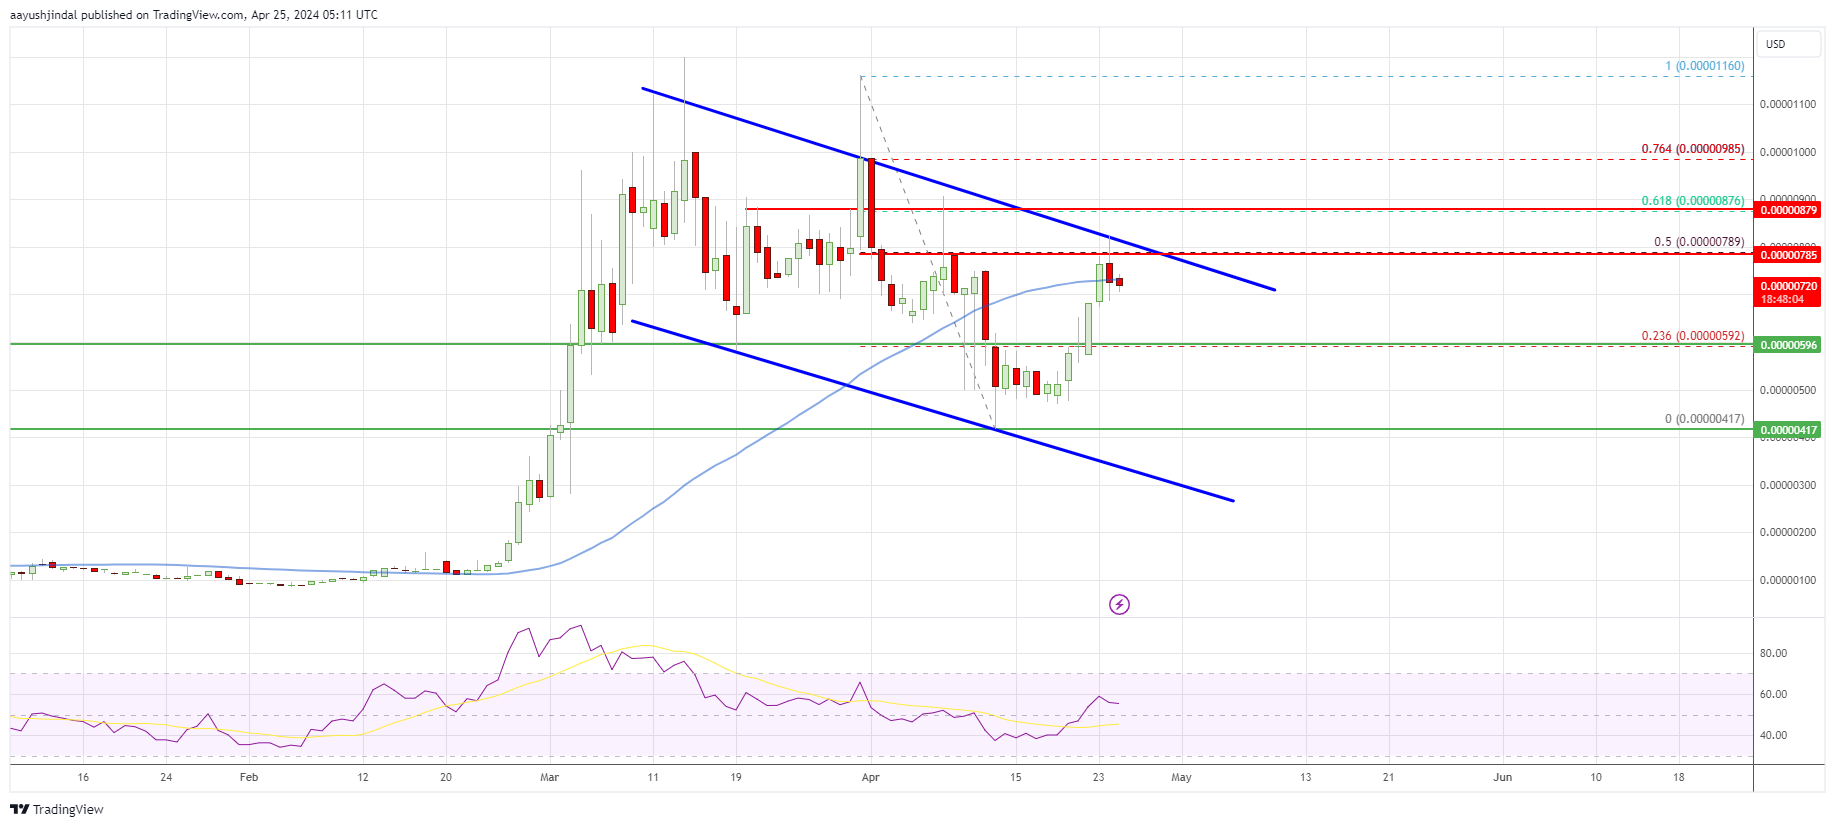
However, the bears remained active near the $0.0000080 resistance zone. They protected an upside break above the 50% Fib retracement level of the downward move from the $0.0000116 swing high to the $0.00000417 low.
The price is now trading just below the 50-day simple moving average (blue). PEPE seems to be following a crucial bullish flag pattern with resistance at $0.00000790 on the daily chart.
To start a fresh surge, the price must settle above the 50-day simple moving average (blue) and the channel resistance at $0.0000080. The next key resistance sits at $0.00000875. It is close to the 61.8% Fib retracement level of the downward move from the $0.0000116 swing high to the $0.00000417 low.
A close above the $0.00000875 level could set the pace for a move above the $0.000010 resistance. The next major resistance might be near the last high at $0.0000116. A daily close above the $0.0000116 resistance zone could open the doors for a move toward the $0.000015 region.
Another Decline?
Conversely, PEPE price might face rejection near $0.0000080 and start another decline. Immediate support is near the $0.0000065 level. The first major support is near the $0.0000060 zone.
A close below the $0.0000060 support might send the price toward the $0.00000417 low. If the bulls fail to protect the $0.00000417 support, there could be a larger decline. In the stated case, the price might decline toward the $0.0000025 support.
Overall, PEPE price is attempting a major upside break above $0.0000080. If the bulls succeed, the price could rally 25%-30%. If not, there could be a drop toward the $0.0000060 support.
The post PEPE Price Prediction – This Bullish Pattern Could Trigger Massive Surge appeared first on CoinChapter.


