Daily Market Review: BTC, ETH, AKT, STX, PENDLE
Today’s market session has seen bulls start on the front foot, as indicated by the increase in the global market cap. The total cap stood at $2.44T as of press time, representing a 2.8% increase over the last 24 hours while the trading volume jumped by 15% within the same period to stand at $69.41B as of press time.
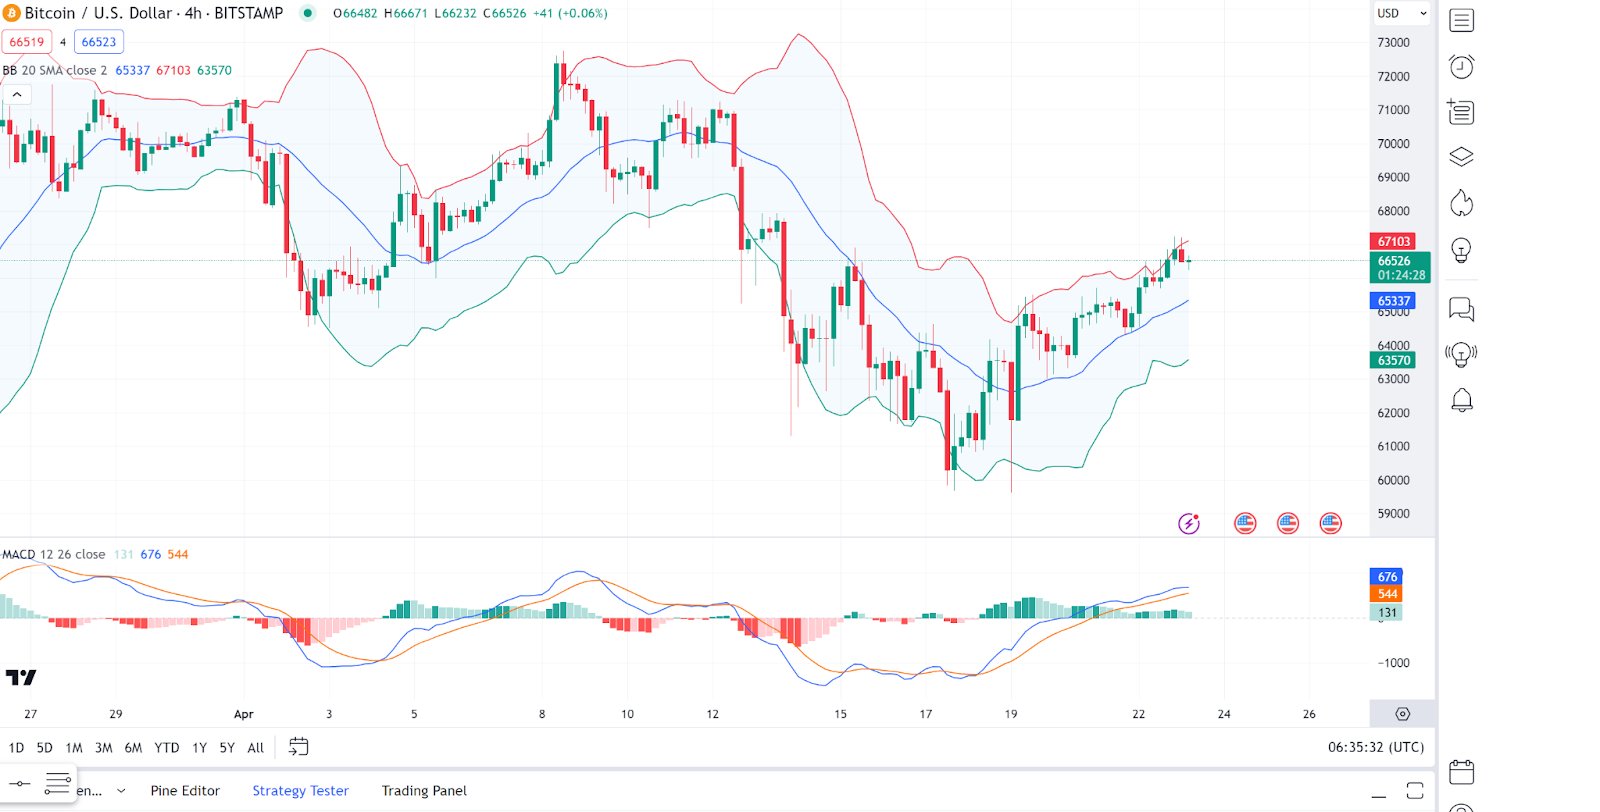
Bitcoin Price Review
Bitcoin (BTC) is having a consolidation session today as it posts some slight gains. Looking at in-depth analysis, we notice that the *BTC* price is trading near the upper Bollinger band. This suggests the market is in a higher volatility phase, with a potential for a continuation of the uptrend or a retracement as prices are relatively high. The Bitcoin price is above the 20-period simple moving average (SMA), which acts as a support level and indicates a bullish sentiment.
On the other hand, the MACD line is above the signal line and above zero, which is a bullish signal. However, the histogram is showing a slight decrease in momentum, which could signal a potential pullback or consolidation. As of press time, the Bitcoin price stood at $66,563, representing a 0.3% increase from its previous 24-hour price.
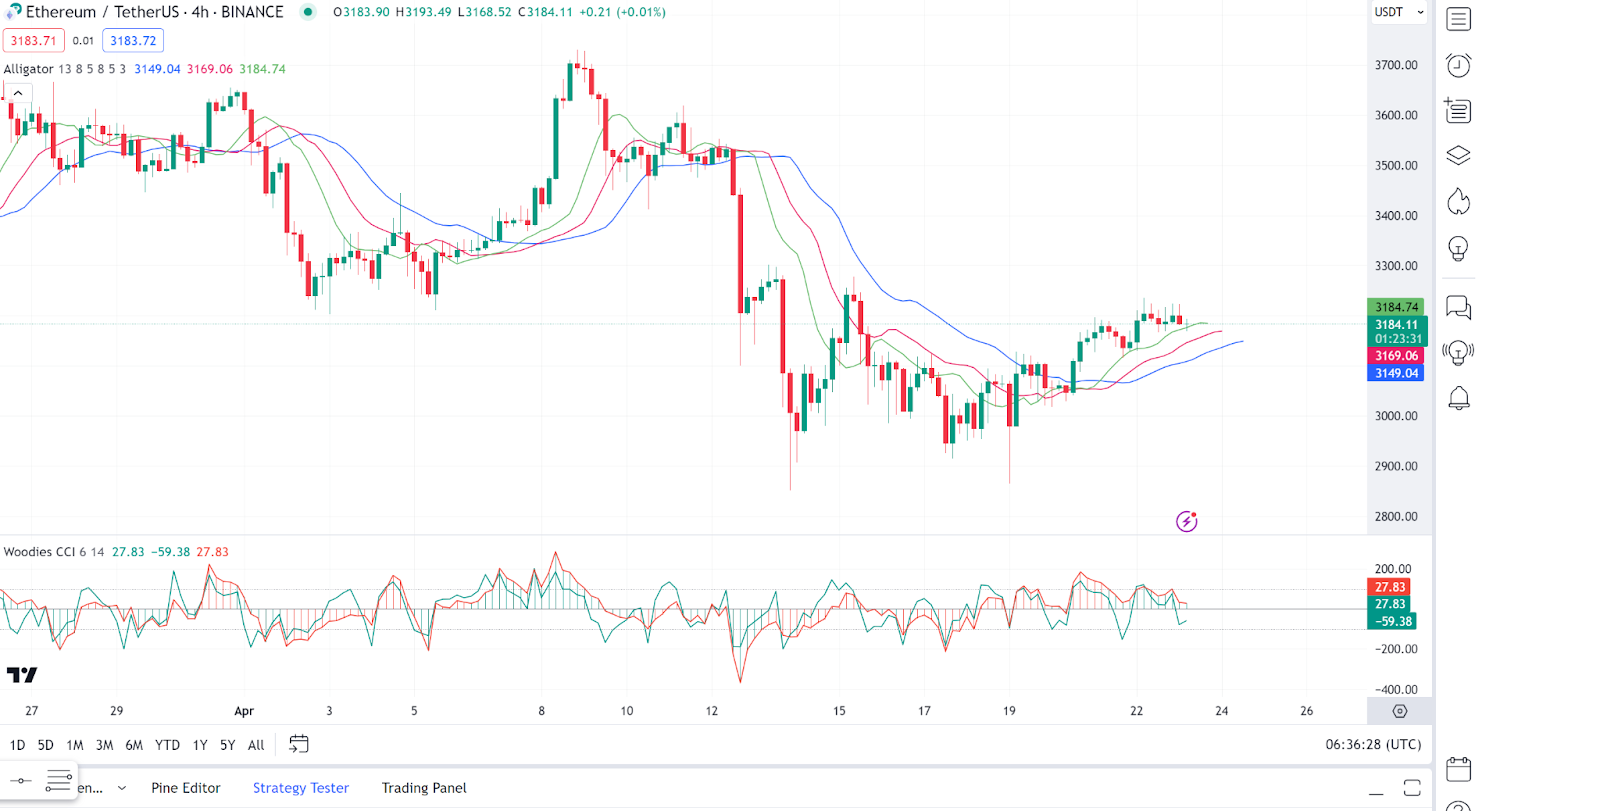
Ethereum Price Review
Ethereum (ETH) is also facing consolidation in today’s session as evidenced by its slight drop in valuation over the last 24 hours. Looking at an in-depth analysis, we see that the *ETH* price is above the Alligator’s jaw (the blue line), which suggests an ongoing bullish phase. However, the lines are intertwined, indicating a lack of a strong trend.
On the other hand, the Woodies CCI (Commodity Channel Index) fluctuates around the zero line, which indicates the market is in a consolidation phase without strong momentum in either direction. As of press time, the Ethereum price stood at $3,184 representing a 1.5% decrease from its previous 24-hour price.
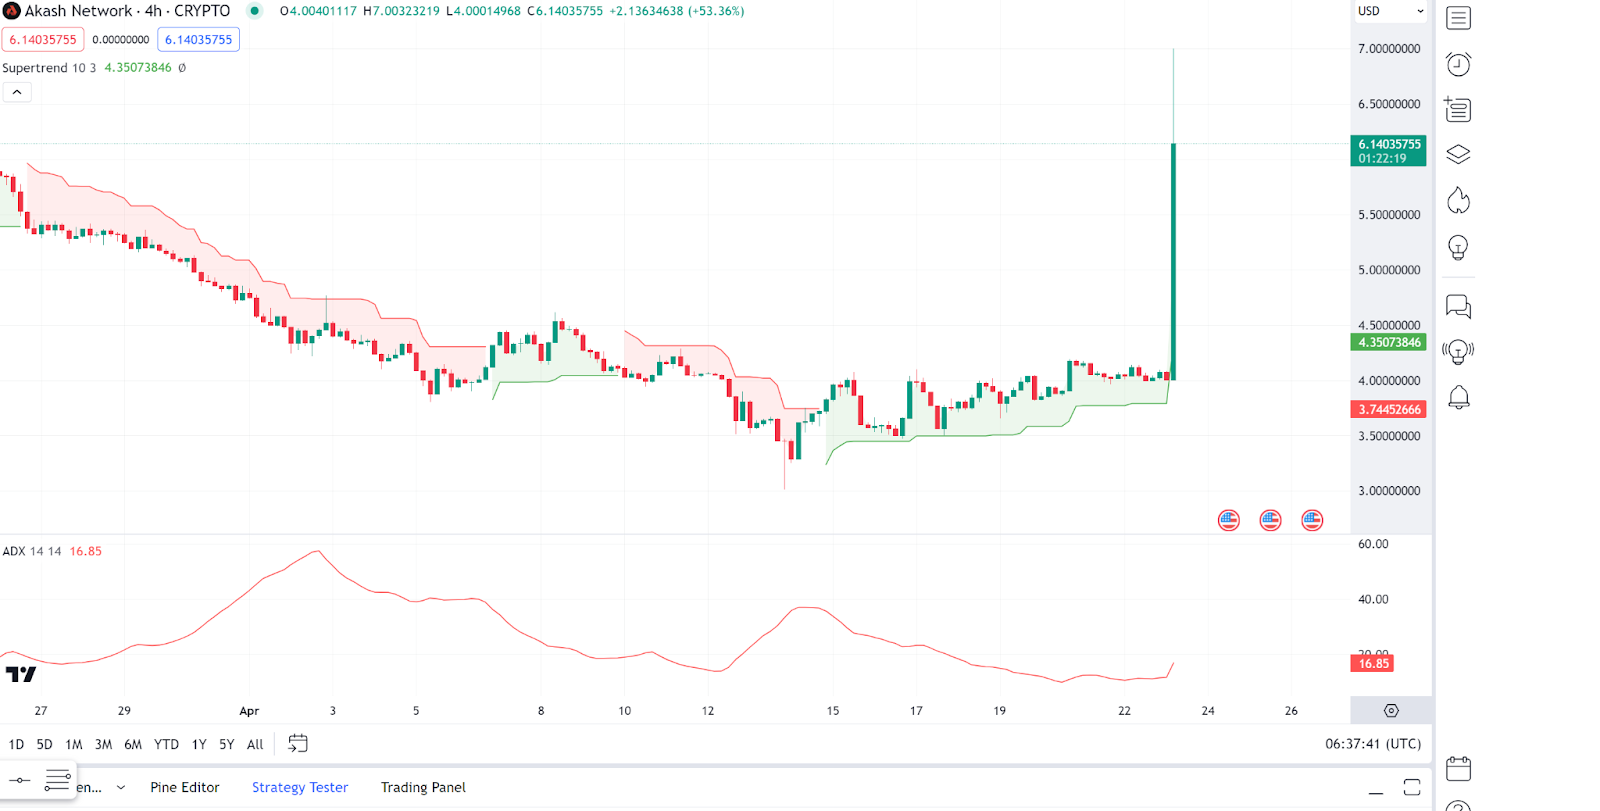
Akash Network Price Review
Akash Network (AKT) is today’s top gainer as the altcoin pops with a surprise rally in today’s session. Looking at Akash Network price charts, we notice the price is above the Supertrend indicator, which has turned green, signalling a bullish trend.
On the other hand, we see that the ADX (Average Directional Index) is below 25, which generally indicates a weak trend. However, given the recent price spike, it may not have reacted yet. At the time of writing, the Akash Network price stood at $5.96, representing a 44.2% jump from its previous 24-hour price.
Stacks Price Review
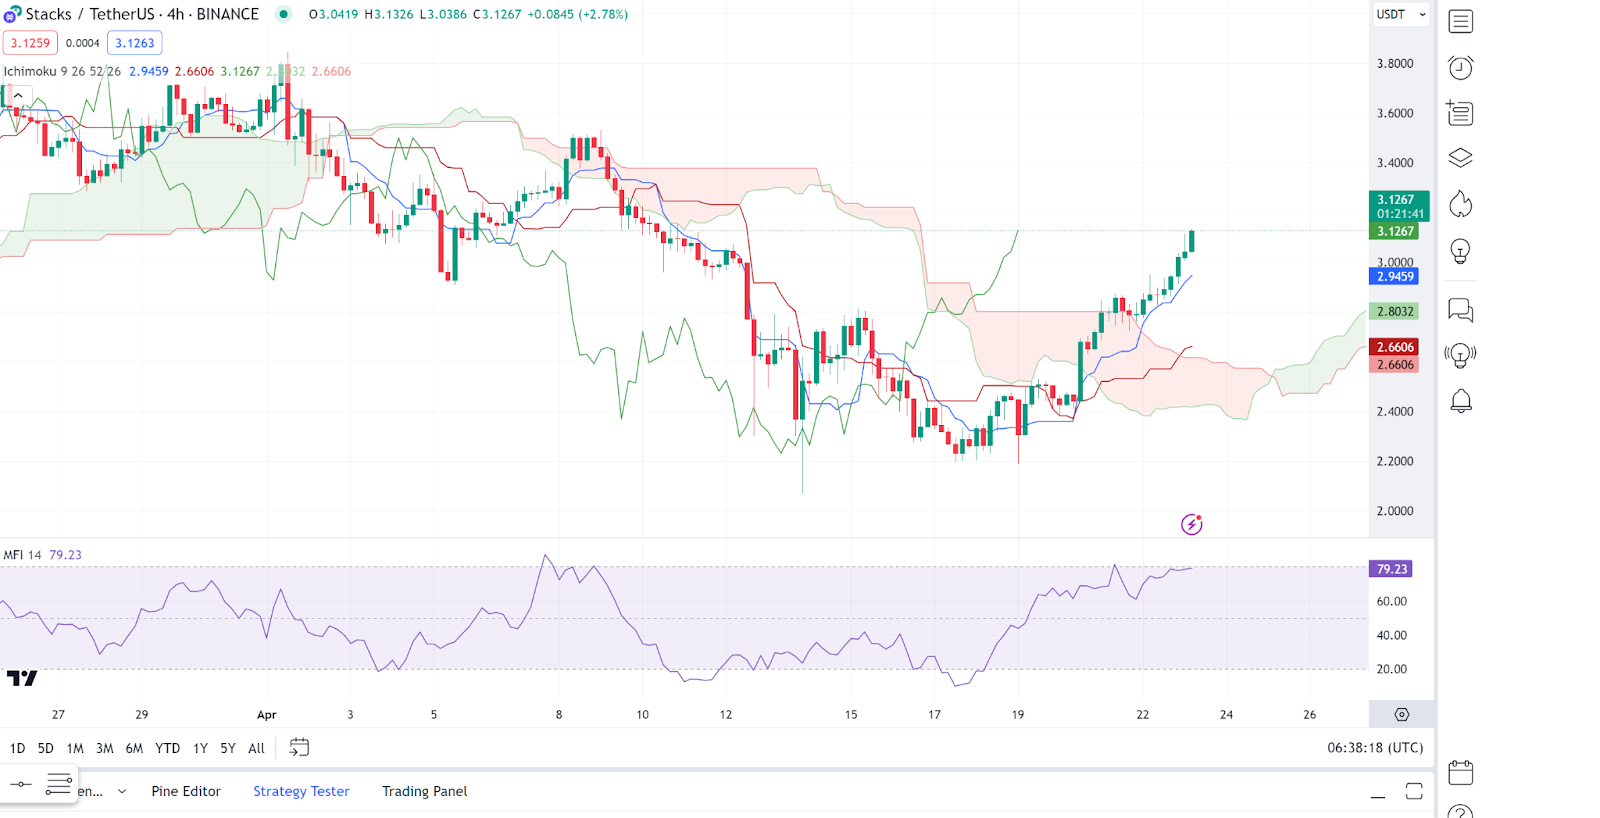
Stacks (STX) was also another gainer in today’s session, posting remarkable gains. An in-depth analysis shows that the Stacks price is above the green Ichimoku cloud, suggesting a bullish trend.
On the other hand, the MFI (Money Flow Index) is above 80, indicating that the asset may be overbought. This could suggest a potential pullback or consolidation in the near term. At the time of writing, the Stacks price stood at $3.12, representing a 7.6% pump on valuation over the last 24 hours.
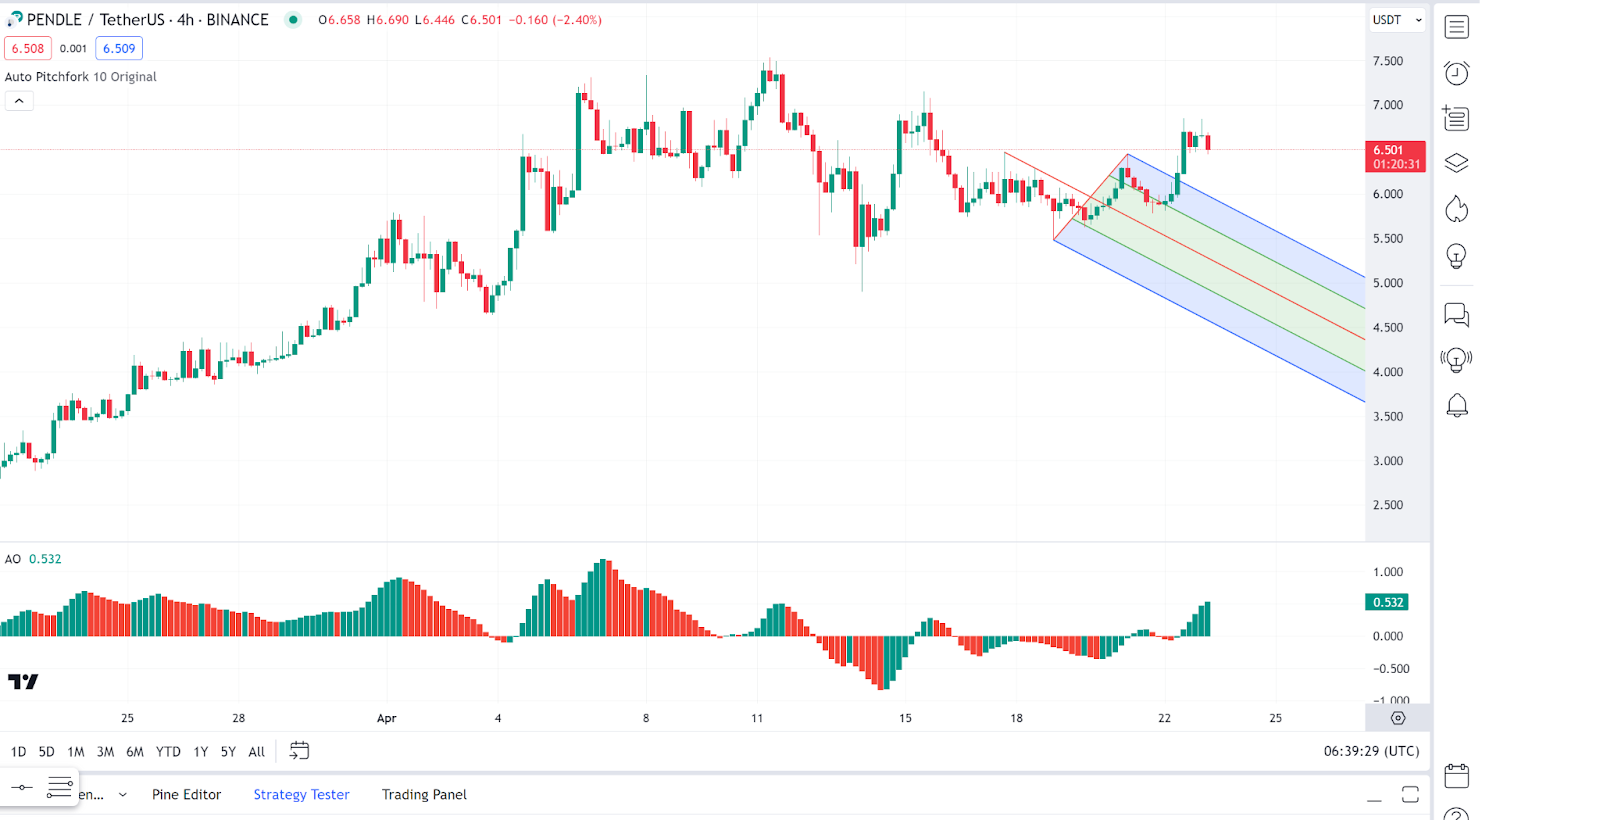
Pendle Price Review
Pendle (PENDLE) is today’s third top gainer as the altcoin managed to post some notable gains as well. Looking at an in-depth analysis, we notice that the Pendle price has broken above the median line of the pitchfork, indicating a potential reversal of the downtrend.
On the other hand, the AO (Awesome Oscillator) is showing green bars above the zero line, indicating bullish buying pressure. At the time of writing, the Pendle price stood at $6.44, representing a 5.6% pump on valuation over the last 24 hours.