Daily Market Review: BTC, ETH, INJ, SUI, LTC
Bears still have control of today’s session as seen from the minimal change in the global market cap over the last 24 hours and the lack of many gainers in today’s session. The global market cap, standing at $2.3T, represented a 0.09% drop over the last 24 hours while the trading volume dropped by 16% to $92.6B.
Bitcoin Price Review
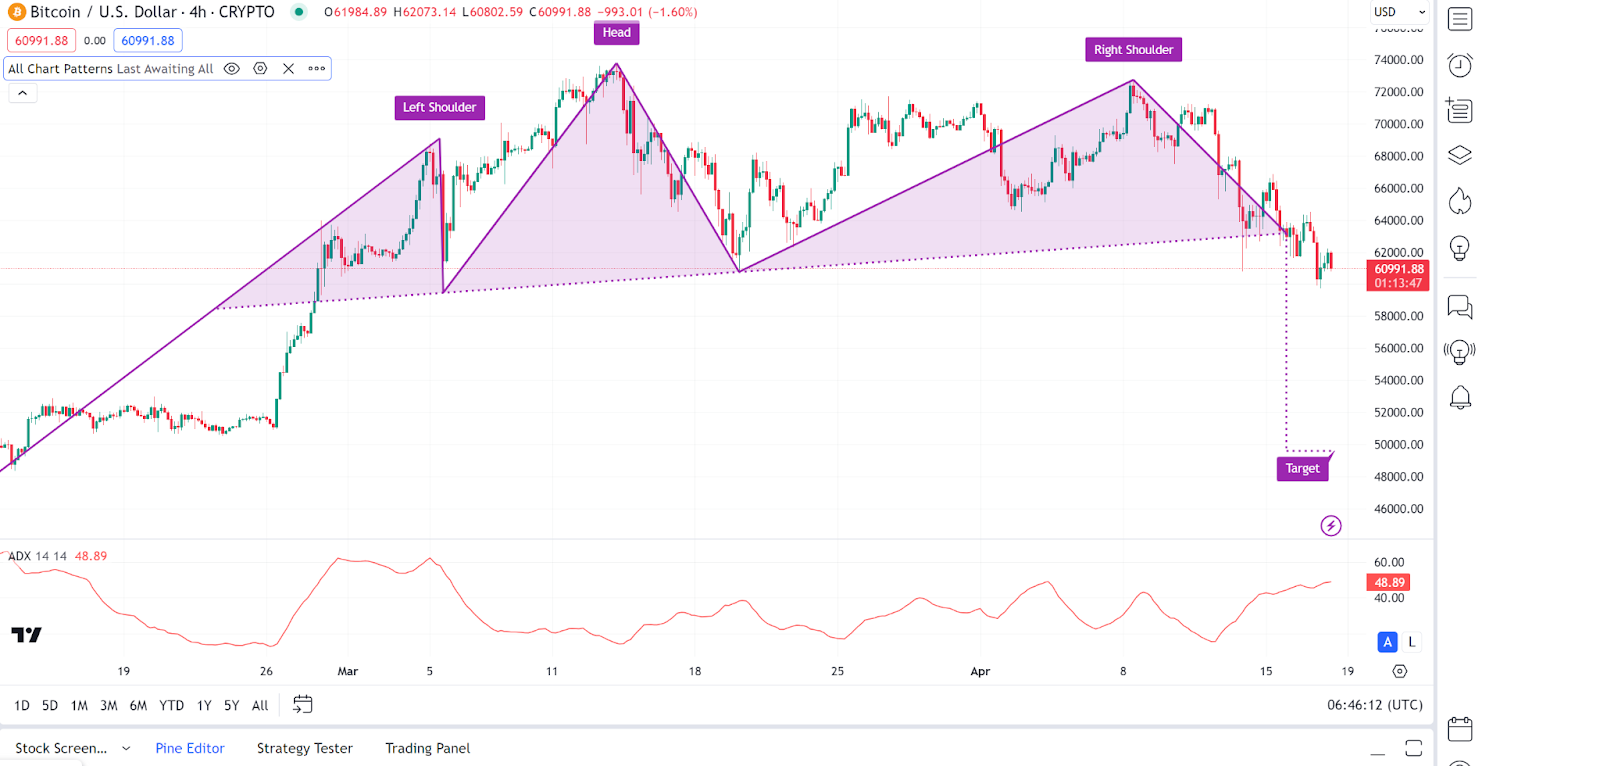
Bitcoin (BTC) is still in a consolidation period as the crypto king fails to post gains in today’s session once again. Analysing Bitcoin price charts, we notice a Head and Shoulders pattern formation. This is a bearish reversal pattern that typically forms after an uptrend and suggests that a reversal to a downtrend may be on the horizon.
On the other hand, the Average Directional Index (ADX) below the chart indicates a strong trend with a reading above 25, reinforcing the bearish outlook. As of press time, the Bitcoin price stood at $61,116, representing a 4.4% decrease from its previous 24-hour price.
Ethereum Price Review
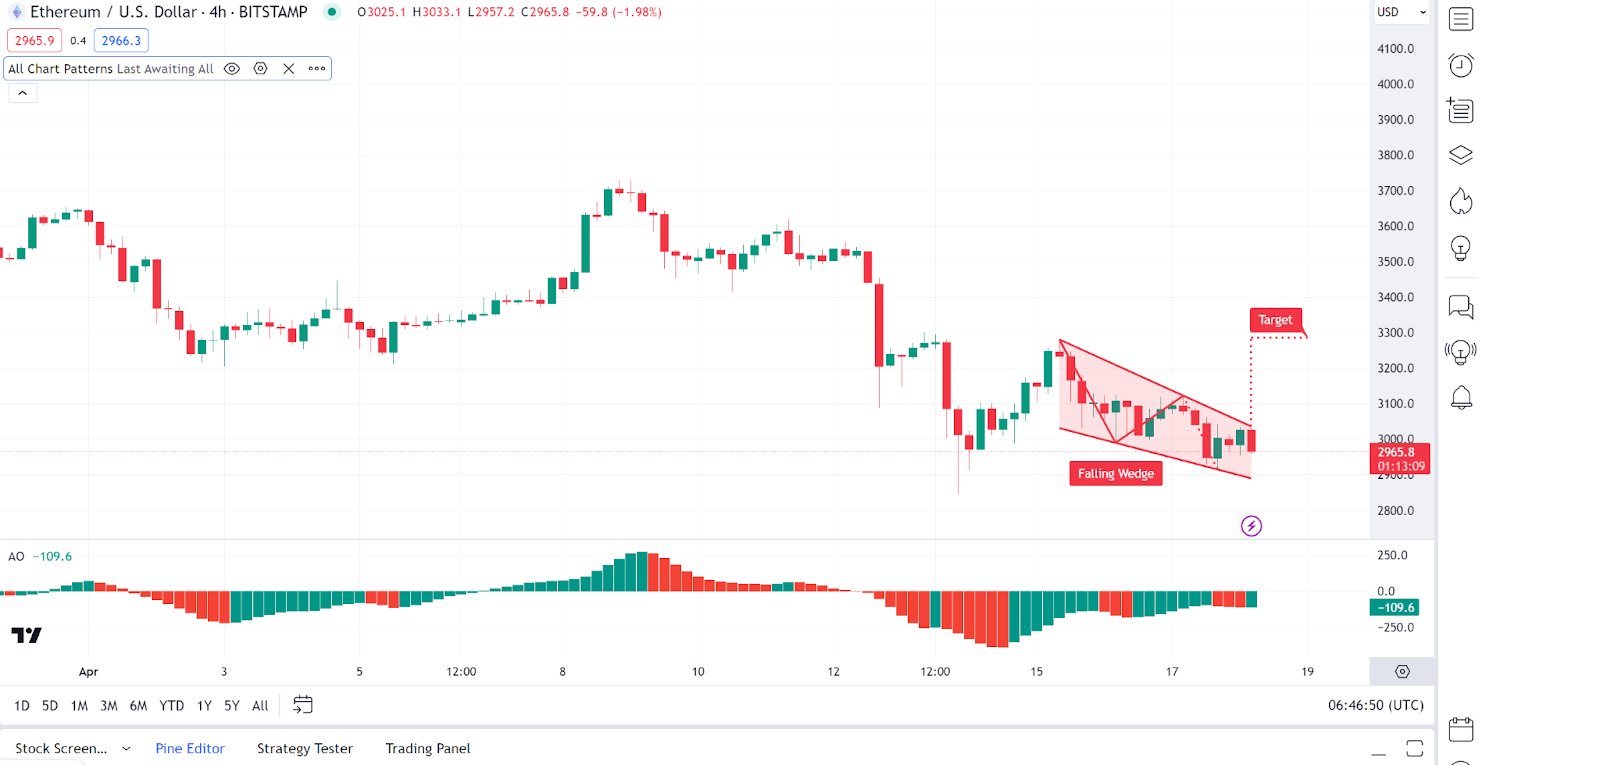
Ethereum (ETH) is also facing a rough session today as it also fails to post any notable gains. Looking at Ethereum price charts. We see a Falling Wedge pattern outlined. This pattern is generally considered to be a bullish pattern that occurs during a downtrend. It signals that a reversal to an uptrend might happen if the price breaks out above the upper trendline of the wedge.
On the flip side, the Awesome Oscillator (AO) at the bottom suggests momentum is currently bearish but may be waning as the bars are becoming shorter. As of press time, the Ethereum price stood at $2,972, representing a 3.8% decrease from its previous 24-hour price.
Injective Price Review
Injective (INJ) is among the few gainers in today’s session despite the general downtrend as it managed some slight positive movements. Looking at Injectice price charts, we notice an Alligator indicator which is used to identify the presence of a trend and its direction. Currently, the lines of the Alligator are intertwined and close to each other, indicating the lack of a strong trend and possibly a sideways market.
On the other hand, the Money Flow Index (MFI) is near the midpoint at 51.85, suggesting a balance between buying and selling pressure. As of press time, the Injective price stood at $25.32, representing a 0.09% increase from its previous 24-hour price.

Sui Price Review
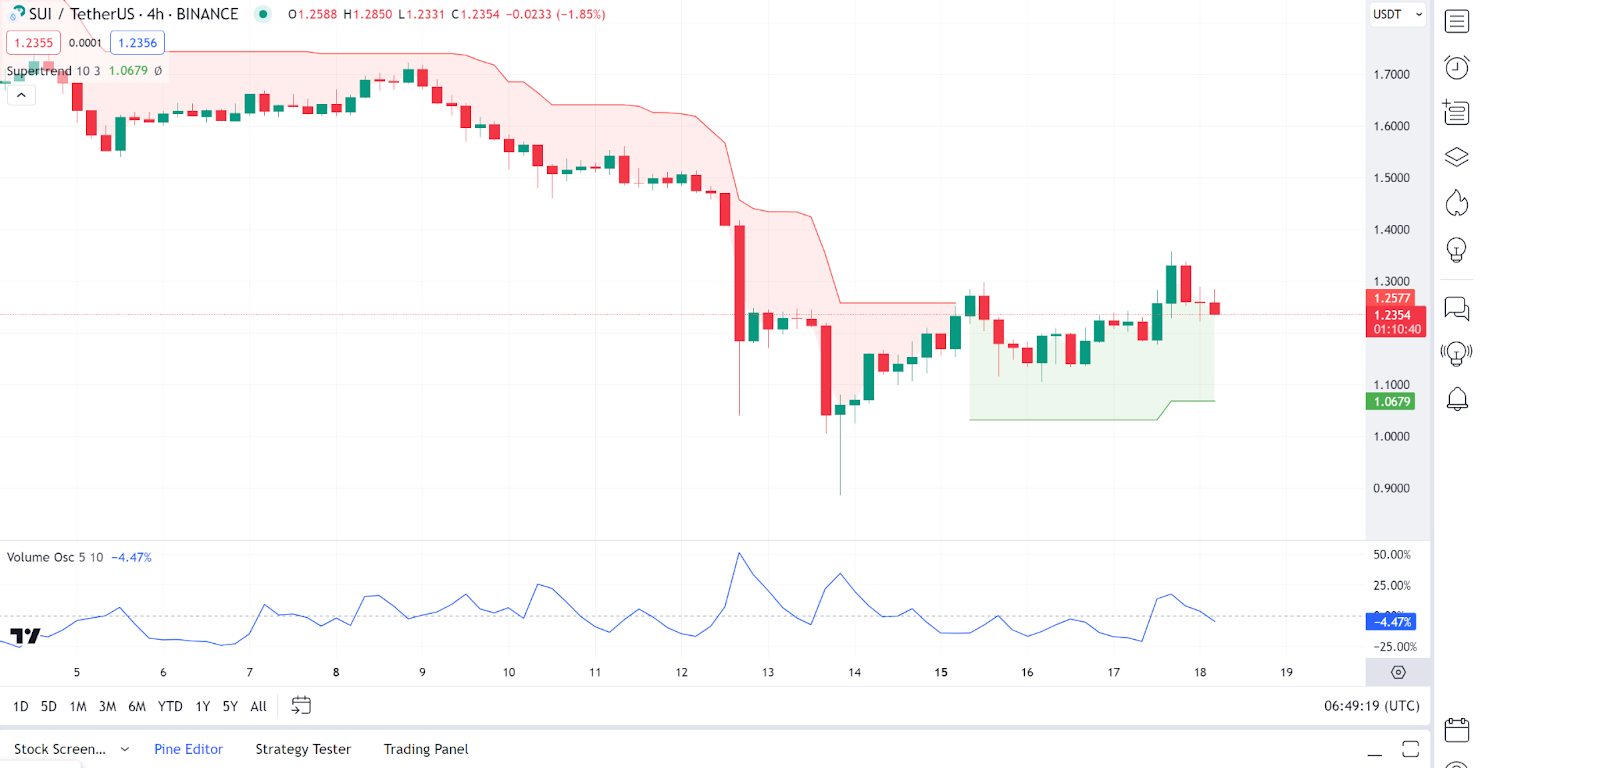
Sui (SUI) is also another gainer in today’s session despite the general downtrend. Looking at an in-depth analysis, we notice that the SuperTrend is above the price and has turned red, indicating a bearish trend. The Sui price is in a consolidation phase within a green highlighted box that suggests support and resistance levels.
Looking at indicators, we see the Volume Oscillator is negative, meaning that volume is decreasing, which could be a sign of decreased interest or uncertainty among traders. As of press time, the Injective price stood at $1.24, representing a 1% increase from its previous 24-hour price.
Litecoin Price Review
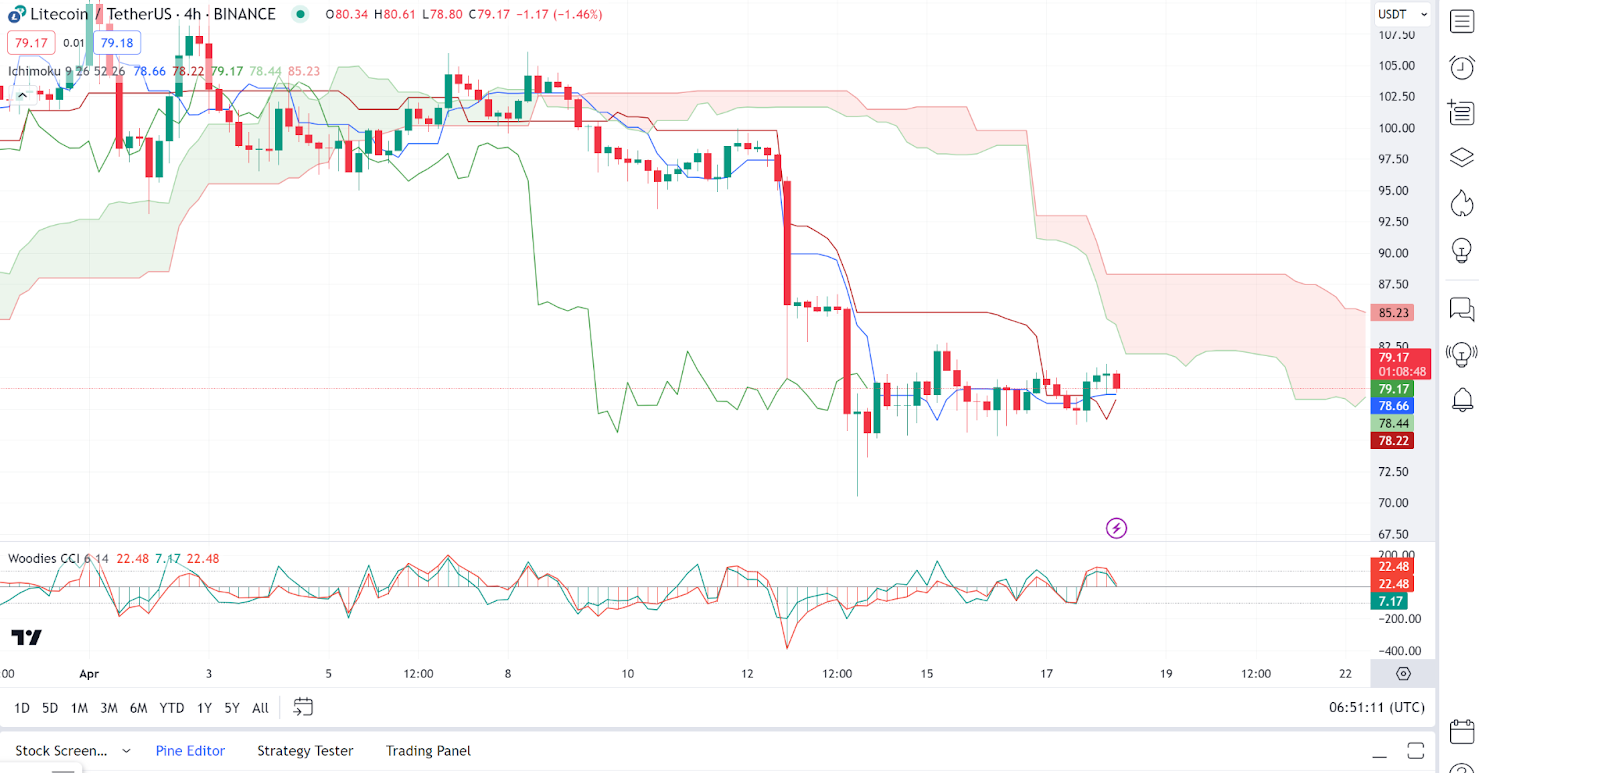
Litecoin (LTC) has also managed some small gains in today’s session despite the general bear trend. Analysing Litecoin price charts, we notice that the Litecoin price is below the Ichimoku Cloud, indicating a bearish trend, and the cloud ahead is red, suggesting the trend may continue.
On the other hand, the Woodies CCI is hovering around the zero line, which points to a potential indecision or consolidation phase. As of press time, the Litecoin price stood at $79.39, representing a 0.77% increase from its previous 24-hour price.