Daily Market Review: BTC, ETH, OMNI, ENA, SUI
Today’s market session has been controlled by bears as seen from the drop in the global market cap. The total cap stood at $2.25 as of press time, representing a 2.45% drop over the last 24 hours while the trading volume dropped by 24% to stand at $88.49B as of the same period.
Bitcoin Price Review
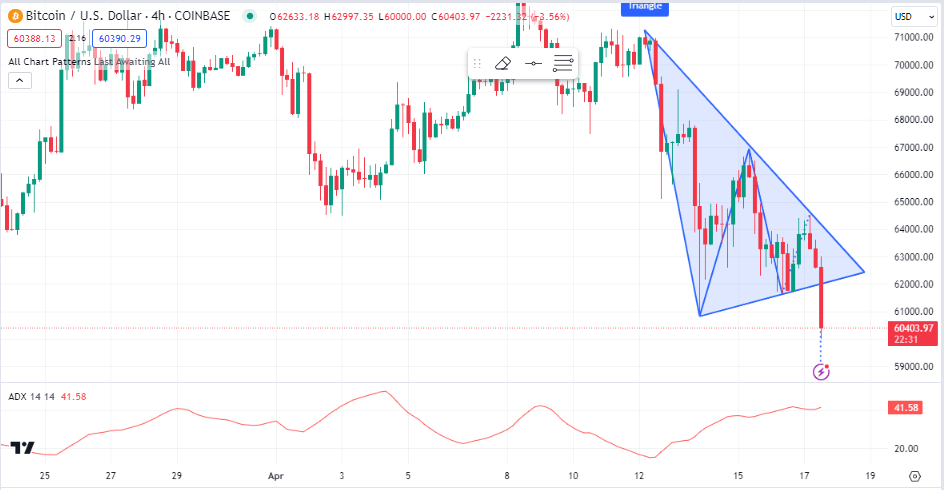
Bitcoin (BTC) is still facing bear activity in today’s session as seen from its price drop in today’s session. The Bitcoin price has made lower highs while maintaining a relatively flat lower bound, indicating diminishing buying pressure. The breakout to the downside suggests a continuation of the bearish trend.
On the other hand,the Average Directional Index (ADX) indicator is above 25, which shows a strong trend, in this case, a strong downtrend. The projection on the chart suggests a further decline in price. As of press time, the Bitcoin price stood at $60,411, representing a 2.6% decrease from its previous 24-hour price.
Ethereum Price Review
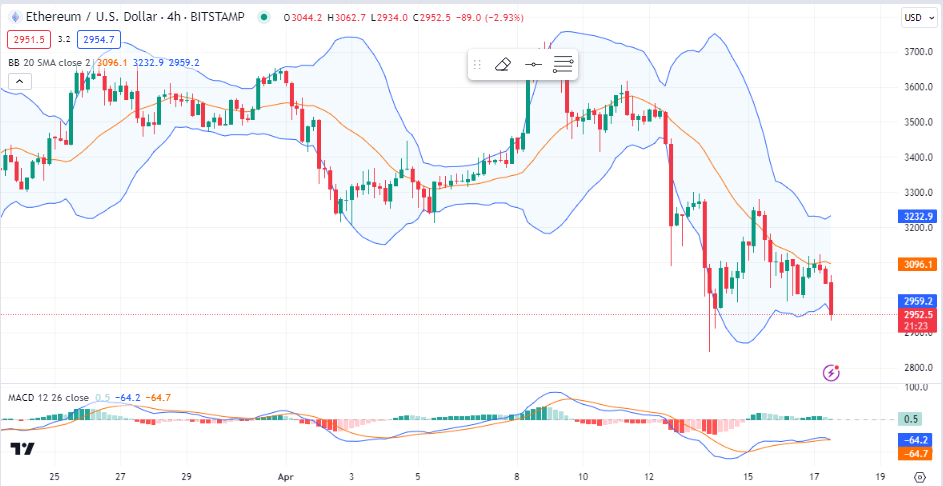
Ethereum (ETH) is also facing a tough session today as it fails to post gains as well. The chart has Bollinger Bands overlaid, and the Ethereum price is trending down while staying mostly within the lower half of the bands, signaling a bearish trend. The Ethereum price is currently at the lower Bollinger Band, which could indicate oversold conditions and potential for a reversal or pullback.
On the other hand, the Moving Average Convergence Divergence (MACD) is below the signal line and is showing red histogram bars, indicating bearish momentum. As of press time, the Ethereum price stood at $2,957, representing a 1.8% decrease from its previous 24-hour price.
Omni Network Price Review
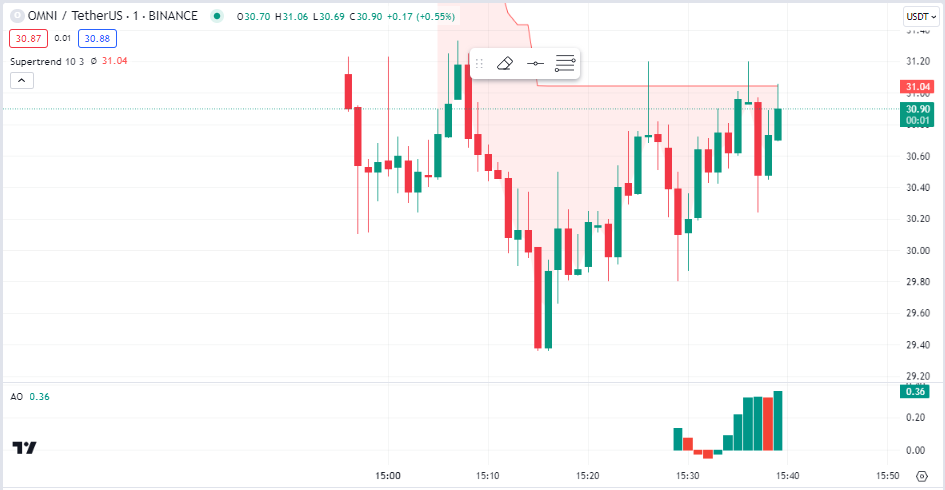
Omni Network (OMNI) has also fallen prey to bear activity in today’s session as it emerges among the top losers. Omni Network price charts show a SuperTrend indicator, which is currently in a red zone above the price bars, indicating a downtrend or sell signal.
The Awesome Oscillator (AO) is barely above zero, which might suggest a weak bullish momentum but considering the price action and the SuperTrend, it is not enough to counteract the bearish indication. As of press time, the Omni Network price stood at $30.85, representing a 25% decrease from its previous 24-hour price.
Ethena Price Review
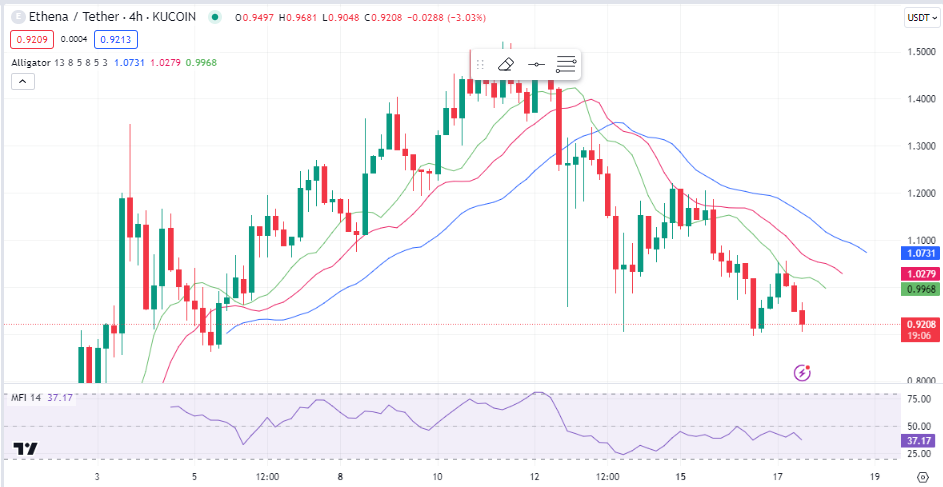
Ethena (ENA) has, however, managed some gains in today’s session despite the general downtrend. Analyzing Ethena price charts, we notice that the Alligator indicator is applied here, and we can see that the Ethena price is below the three moving averages that represent the Alligator’s jaws, teeth, and lips, signaling a downtrend.
On the other hand, the Money Flow Index (MFI) is below 50, leaning towards an indication of more selling pressure than buying pressure. As of press time, the Ethena price stood at $0.9298, representing a 1.49% increase from its previous 24-hour price.
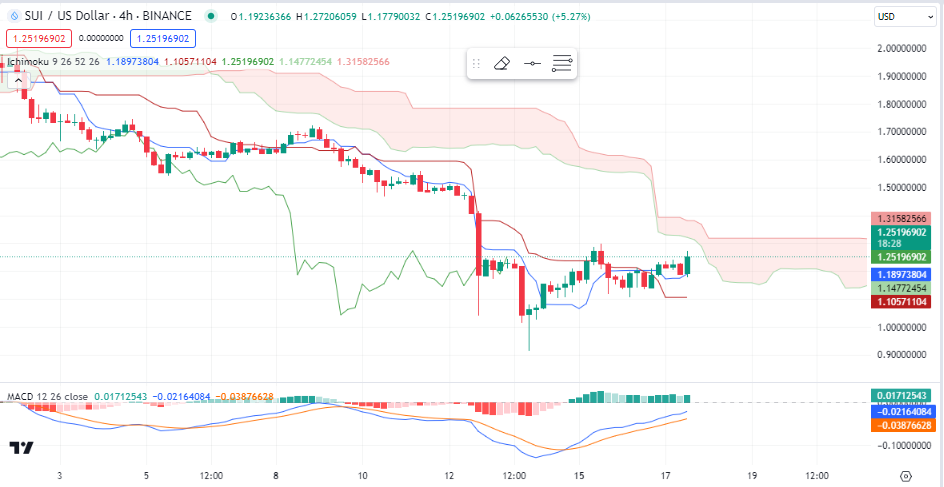
Sui Price Review
Sui (SUI) is also another gainer in today’s session as the altcoin also managed some notable gains in today’s session. Looking at an in-depth analysis, we notice an Ichimoku Cloud, and the Sui price is below the cloud, which is typically a bearish signal.
On the other hand, the MACD is below the signal line and the zero line, which confirms the bearish momentum. The lagging span is below the price and within the cloud, which doesn’t indicate strong momentum but still aligns with the overall bearish sentiment. As of press time, the Sui price stood at $1.27, representing a 9.2% increase from its previous 24-hour price.