Polkadot price analysis: A downward spiral reduces the DOT worth to $7
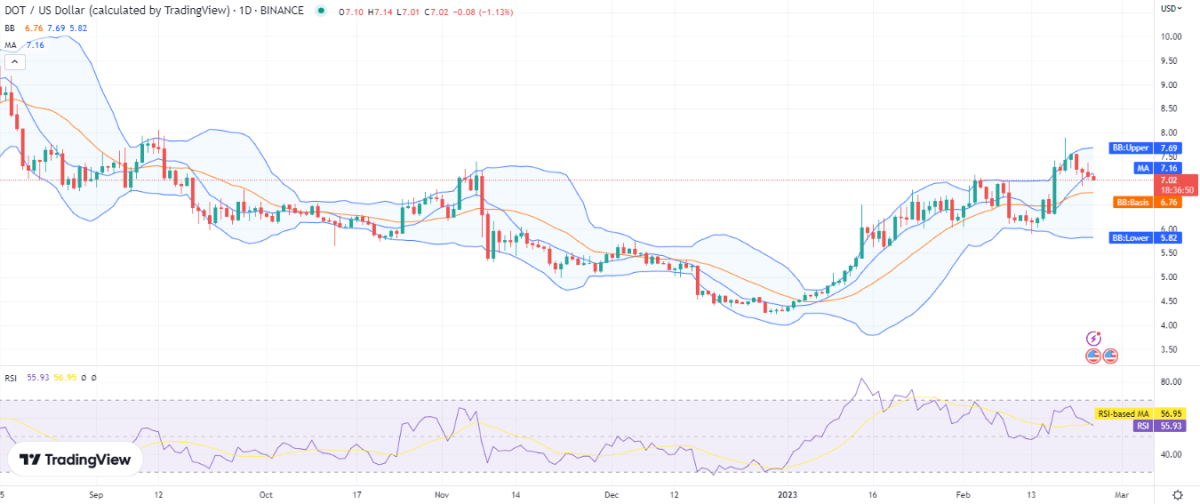
A decreasing price movement has been seen, and the Polkadot price analysis is supporting a bearish pattern for the day. Since a few days ago, bears have been in charge of the market, and the price has been falling steadily. The bears have been effectively maintaining their advantage, preventing the bulls from mounting a comeback. The bearish impact has caused the price to drop today to $7.02.
DOT/USD 1-day price chart: Cryptocurrency devalues by 4.33 percent overnight
Given the market’s downward movement, the one-day Polkadot price analysis predicts a bearish day. Since its last peak of $7.55 on February 20, 2023, the price has been on a downward trajectory, and the cryptocurrency has been continuously losing value. Given that there has also been a downward tendency over the past 24 hours, the bullish momentum has not yet been regained. The price is currently nearing the $7.02 low, which is considerably lower than the moving average (MA) value of $7.16. However, $7 is also a support level, which if it is maintained, can act as a stopgap for the declining price levels.

During the previous week, there was also a crossover between SMA 20 and SMA 50, which was a bullish win indication, but the situation has changed. The higher Bollinger band value is now $7.69, and the lower Bollinger band value is now $5.82 due to the rise in volatility. Selling action in the market is indicated by the Relative Strength Index (RSI) score, which has fallen to index 55.
Polkadot price analysis: Recent developments and further technical indications
For the past few hours, the price has been moving lower as the bears have taken control of the price chart’s dominant stance according to the Polkadot price analysis. As the bearish trend has gotten stronger, the price has dropped to $7.02 today. Thus, the coin experienced another negative four hours as more selling activity was seen. On the price chart for the past four hours, the moving average value is located at the $7.17 mark.

The Bollinger Bands average, which is currently $7.20, has also dropped over the past four hours. The Bollinger Bands Indicator’s higher value is $7.48, while its lower value is $6.91. As the price has been continuously falling, the RSI score has decreased to index 42.
Polkadot price analysis conclusion
Given that the bears have been winning the game for a few days, the Polkadot price analysis shows that the price has dropped today to $7.02. Today, a declining tendency has been noticed, and the price has also moved downward. Due to the price decline, the hourly forecast also predicts negative outcomes for buyers.


