ChainLink price analysis: LINK obtains bearish momentum at $7.2
ChainLink price analysis for March 30, 2023, indicates a decline in the market, with negative momentum. Over the past few hours of March 29, 2023, the value of LINK has exhibited a consistent bearish trend, experiencing a decline from $7.4 to $7.3. Additionally, the market has demonstrated a downward trajectory, causing the price of ChainLink to further decrease and ultimately reach a value of $7.2, thereby only marginally surpassing the $7 threshold.
As of today, March 30, 2023, Chainlink’s market price stands at $7.25 with a trading volume of $808.06M, a market capitalization of $3.75B, and a market dominance of 0.32%. In the past 24 hours, the price of LINK has witnessed a decline of -1.46%. Chainlink’s highest price of $52.89 was recorded on May 10, 2021, while its lowest price of $0.126297 was documented on Sep 23, 2017. The lowest price since the all-time high was $5.36 (cycle low), and the highest price was $9.45 (cycle high).
Currently, the Chainlink price prediction sentiment is neutral, and the Fear & Greed Index is reflecting a greed rating of 60. In terms of circulating supply, Chainlink has 517.10M LINK out of a maximum supply of 1.00B LINK, and the yearly supply inflation rate is 10.73%, leading to the creation of 50.09M LINK in the last year. Chainlink is currently ranked #4 in the DeFi Coins sector and ranked #7 in the Ethereum (ERC20) Tokens sector in terms of market capitalization.
LINK/USD 1-day price analysis: Latest developments
ChainLink price analysis shows a volatile market, with a downward trend. The recent market behavior of ChainLink suggests that the price is demonstrating a relatively stable trend with a lesser inclination toward fluctuations. The opening price of ChainLink was $7.28, and its highest price observed was $7.31. Despite some minor variations, the price remained relatively stable, with the lowest recorded value at $7.25 and a closing value of $7.25. Presently, the ChainLink market is undergoing a decrease of -0.45%.
At present, the LINK/USD price is situated above the Moving Average, which implies a bullish market trend. Nevertheless, despite the dominance of bullish investors, the LINK/USD price is experiencing a downward trajectory, signaling a bearish trend. The overall market sentiment is pessimistic, with a considerable potential for further decline.
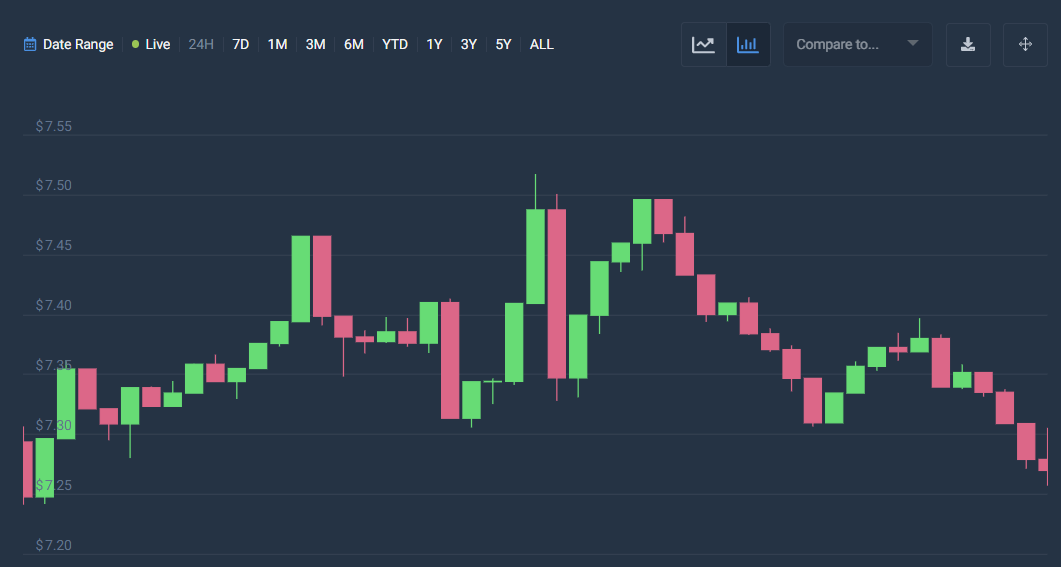
ChainLink price analysis reveals that the Relative Strength Index (RSI) is 52 showing a stable cryptocurrency market. ChainLink is presently undergoing a phase of depreciation, with a declining value. This trend is primarily attributed to the preponderance of selling activities, leading to a drop in the RSI score and consequently aggravating the downward movement of the market.
ChainLink price analysis for 7-days
ChainLink price analysis indicates that the market is presently undergoing a phase of volatility following a period of decline. This observation suggests that the ChainLink price is displaying a reduced susceptibility to extreme variations in either direction. The opening price of ChainLink was documented at $7.28, with the highest price being $7.31. Conversely, the lowest price noted was $7.25, signifying a shift of -0.32%. The close price for the period was recorded at $7.26.
Current market analysis suggests that the LINK/USD price is currently trending above the Moving Average price, indicating a bullish trend. However, recent market movements over the past few hours have demonstrated a bearish bias, corroborating this observation. Moreover, a negative market movement has contributed to the depreciation of ChainLink’s value, further strengthening the bearish control over the market.
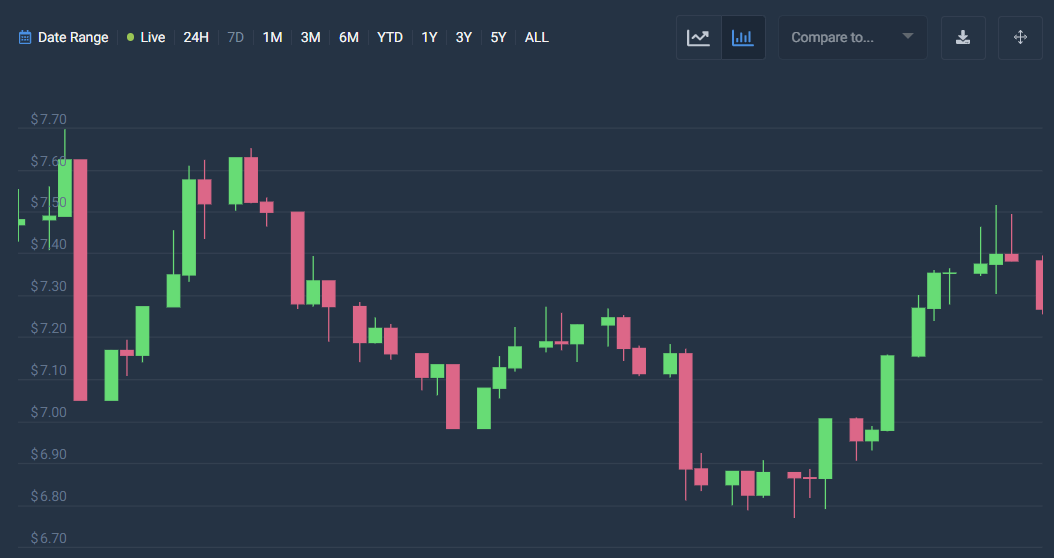
Chainlink price analysis shows the Relative Strength Index (RSI) to be 49, signifying a stable cryptocurrency. As per the present analysis, the LINK cryptocurrency is presently situated in the central neutral region of the market. Furthermore, the trend observed in the Relative Strength Index (RSI) indicates a shift towards a downward movement, typically indicative of a bearish market. The decreasing RSI score provides additional evidence of the prevalence of selling activities within the market.
ChainLink Price Analysis Conclusion
Chainlink price analysis indicates that the cryptocurrency is currently following a bearish trend, indicating substantial potential for negative market activity. Moreover, the prevailing market conditions are demonstrating a downward trajectory, implying the possibility of additional price depreciation in the future.