Ethereum price analysis: ETH price sinks to $1,612 after the latest bearish shift
Ethereum price analysis indicates a bearish shift in the market. The bears have been controlling the price trends for the past few days after the price peaked at $1,682 last week, and today the price faced a bearish reduction once again. After the latest bearish shift, the price levels have plunged to $1,612 as of this writing. It seems that the current downtrend will continue further as the sellers have taken over the market, which is why the market sentiment is negative. However, the next support for ETH is present at the $1604 level, and if the price rebounds from this level, it could lead to a reversal in the trend.

The trading volume is decreasing, which is a sign that the buyers are not putting any significant pressure on the market. The trading volume has decreased to $8.93 billion, while the market capitalization is $197 billion. The overall market sentiment is bearish, and it looks like the bears are in control of the trend at the moment.
Ethereum price analysis 1-day price chart: Downside continues as bears drag price to $1,612 low
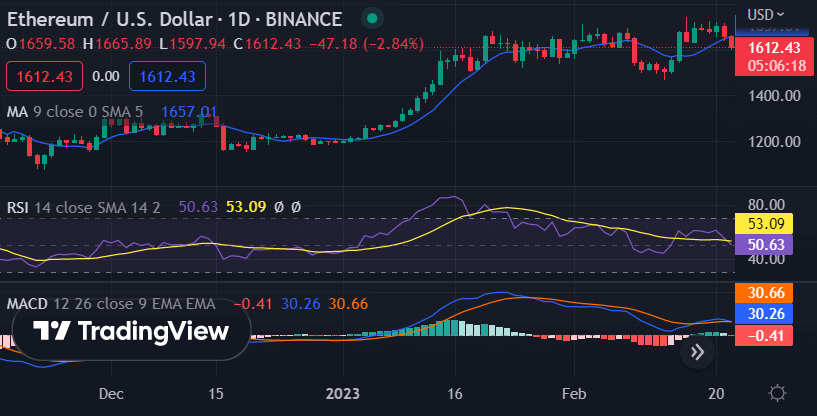
The 24-hour Ethereum price analysis favors the bears as a drop in cryptocurrency value has been recorded in the past 24 hours. The bears have been in the leading position for the past week, and the price has been following a constant downward movement. The price has been brought down to a $1,612 low because of the latest bearish turn, as the cryptocurrency has shed another 3.88 percent in the past 24 hours. The overall trend is bearish, and a further drop in value is expected unless the buyers can come up with some strong resistance at key levels.

The 24-hour technical indicator is also bearish, as the MACD indicator shows a downward curve. The signal line has crossed below the MACD line, indicating an increase in selling pressure and more sellers entering the market. In addition to this, the RSI (Relative Strength Index) has dropped to 50.63 levels, which further confirms that the bears are in control of the trend. Meanwhile, the moving average is at $1657.01, with 50-day and 200-day MA indicating a bearish crossover.
ETH/USD 4-hours price chart: Recent developments and further technical indications
The hourly Ethereum price analysis gives the lead to the bears as well, as the price has been under the bearish shadow for the past few hours. A constant reduction in ETH/USD market value has been observed over the past four hours as well, as it moved down to a $1,612 low. It seems that the current decreasing trend will extend further in the approaching hours as the selling momentum is gaining strength.

Moreover, the moving average value in the hourly price chart is $1648.53. The moving average converges divergence (MACD) indicator shows a bearish crossover, with the signal line crossing below the MACD line. Moving on to the RSI score, it plunged to 29.80 levels after the latest selling activity.
Ethereum price conclusion
Ethereum price analysis is bearish, and the downtrend will continue further as long as the bears remain in control. The next support level for ETH/USD is at $1604, and if this level holds, it could lead to a reversal in the trend. However, until that happens, the market sentiment will remain bearish with more sellers entering the market.
While waiting for Ethereum to move further, see our Price Predictions on XDC, Cardano, and Curve


