Bitcoin price analysis: Bearish trend continues as BTC price remains below $24,705
Bitcoin price analysis indicates a negative sentiment in the market. The bearish action is being driven by lower trading volumes and weak demand for BTC/USD pairs. The last attempt to stage a bullish recovery failed as momentum faded after the key resistance level of $24,705 was reached. BTC/USD prices are currently trading at around $23,978, down from highs of $25,000. As the bears try to push prices lower, support is present at the $23,902 level. If the bears fail to break below this level, then a consolidation phase could take place.

The digital asset has faced selling pressure over the last few days due to a lack of momentum. Looking ahead, we can expect some consolidation in the short term as traders wait for news that could push prices higher. The bulls are likely to target resistance levels of $24,705 and $25,000, which, if broken, could send BTC/USD prices higher. The market cap for Bitcoin is currently around $457 billion, and trading volume over the past 24 hours has been about $30 billion.
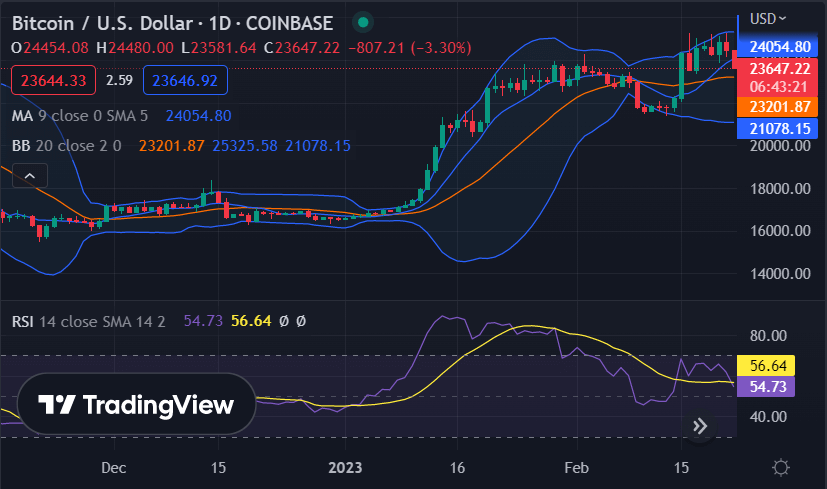
BTC/USD 1-day price chart: Cryptocurrency value steps down to $23,978 after a downturn
The one-day Bitcoin price analysis confirms a negative trend for the cryptocurrency, as the bears remained dominant during the day. Although the bullish curve was progressing swiftly in the earlier days, today’s trend is going relatively in favor of the bears. The price has been reduced to $23,978 because of the ongoing decreasing trend. If we discuss the moving average (MA) value in the one-day price chart, it is standing at the $24,054 level.

The volatility of the BTC/USD pair has decreased significantly as well. The Bollinger Bands are getting tight, which also suggests a period of consolidation in the near future. The upper Bollinger Band lies at $25,325, and the lower lie at $21,078. The relative strength index (RSI) is hovering around the 54.73 level, indicating a neutral market sentiment.
Bitcoin price analysis: Bearish slide relocates price to $24,705 low
The four-hour Bitcoin price analysis confirms a declining trend, as the bears have been ruling the price chart for the past few days. A consistent drop in BTC/USD value was recorded for the previous hours, and the price dropped to $24,705 in the last four hours. The bearish wave is to continue in the approaching period as well as the selling activity is on the rise.

The price is now standing lower than its moving average value of $24,216. The bearish trend is confirmed with the help of a crossover between the 50-day MA and 200-day MA line that happened earlier today. The relative strength index (RSI) confirms this by dropping to 34.66 levels, which suggests downbeat activity in the market. The Bollinger bands are also tilted towards the lower end, which implies that the bearish action could intensify further. The SMA 20 curve is still moving at a greater height than the SMA 50 curve, as the bulls were ahead of the bears in the earlier part of the day.
Bitcoin price analysis conclusion
To Sum up, the bearish trend in BTC/USD is likely to continue in the near future as traders remain cautious and uncertain about the market. Moreover, the outlook remains bearish for BTC/USD in the short term, although a longer-term price increase is still possible if support holds at $23,902. For now, we can expect some price volatility in the coming days as traders digest recent developments.
While waiting for Bitcoin to move further, see our Price Predictions on XDC, Polkadot, and Curve


