Avalanche price analysis: AVAX continues to decline after hitting $16 low
Avalanche price analysis continues to show a bearish trend in place, as price dropped another 3 percent over the past 24 hours to move down to $16. After initially recovering from this price point on March 17, AVAX has remained unable to challenge up to the $18 resistance point. Successive bearish candlesticks can be observed on the daily chart, after a brief period of sideways movement. Meanwhile, the token could be tipped for a decline down to the $13 mark over the current trend, just below the $14.41 support.
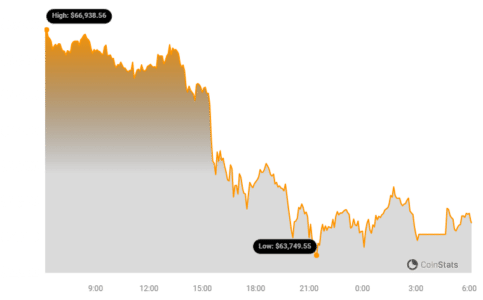
The larger cryptocurrency market also showed similar signs of decline across the board, as Bitcoin slipped down below the $27,000 mark with a 4 percent drop. Ethereum followed suit, dipping 3 percent to $1,700. All leading Altcoins showed similar output over the past 24 hours, apart from Ripple, that rose 6 percent to $0.47. Dogecoin dropped 2 percent to stay at $0.07, whereas Cardano also stayed at $0.34. Meanwhile, Polkadot dropped 3 percent to move down to $5.77.

Avalanche price analysis: Bearish technical indicators seen in majority on daily chart
On the 24-hour candlestick chart for Avalanche price analysis, price can be seen slipping down once again after a brief period of recovery over last week. AVAX price dropped down to $16 over the past 24 hours, with support currently found at the $14.5 mark. With yesterday’s downtrend, price finds itself just below the 9 and 21-day moving averages on the daily chart, along with the important Exponential moving average (EMA) at $16.75.

The 24-hour relative strength index (RSI) can also be seen oscillating in a downward direction to move towards the oversold zone with current reading at 47.54. Meanwhile, the moving average convergence divergence (MACD) curve can also be seen posing a bearish divergence, with the trend line just about to diverge below the signal line.
Disclaimer. The information provided is not trading advice. Cryptopolitan.com holds no liability for any investments made based on the information provided on this page. We strongly recommend independent research and/or consultation with a qualified professional before making any investment decisions.