Chainlink price analysis: LINK forms a bearish pattern at $7.48
Chainlink price analysis shows a bearish price movement today, with LINK/USD forming a bearish pattern today, as the coin has broken below the $8.00 psychological mark. Bears have covered a range downwards since yesterday as the LINK price has come down to $7.48.
The coin may get support soon, as the price movement is low today and this current price level has proved to be strong support during the past weeks. At the same time, selling pressure is also high above the $7.35 range which is why bulls have been unable to uplift prices above the $7.81 level.
Chainlink price analysis 1-day price chart: Bearish pushes LINK/USD down to the $7.48 mark
The one-day price chart for the Chainlink price analysis shows that prices have been pushed lower in a bearish pattern, with bears dominating since yesterday. The coin has been struggling to recover and break above the $7.81 mark as selling pressure is higher than buying pressure today. The LINK/USD reports a 3.88% decrease in price over the past 24 hours. The 24 trading volume has also decreased to $451,634,723 and the market cap is currently at $3.78 billion.

The LINK price is trading below the moving average of the 50-day moving average, which further supports the bearish momentum. The technical indicators are also bearish as the MACD indicators have been trading lower today, with red bars indicating a bearish pattern in the market. The RSI is also trading low at 54.35 and suggests that there could be further drops if prices continue to move lower.
Chainlink price analysis: Support for LINK/USD is present at $7.35
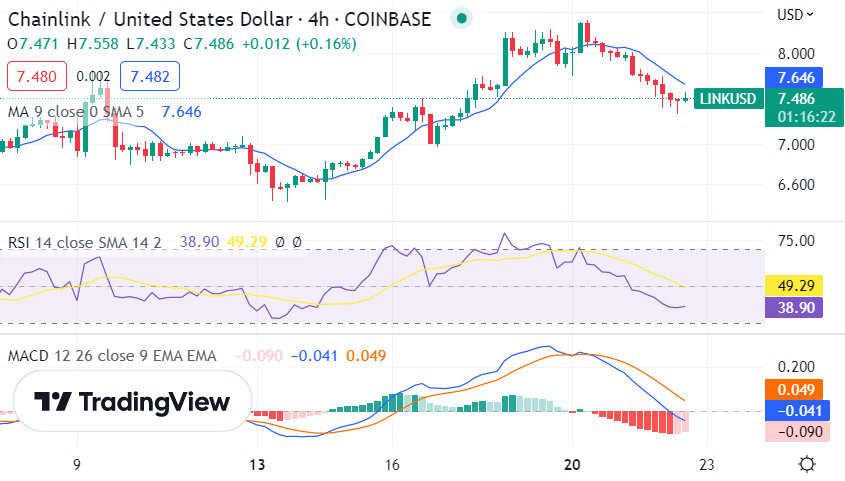
The 4-hour price chart for Chainlink price analysis shows the coin is at the loss for the day as the price is on the decreasing side, but bulls are also trying to make a comeback, but yet the price has not been uplifted, however, The bullish pressure was seen earlier this week when prices were trading above $8.00, but the bears have managed to push it lower again.

The hourly technical indicators are bearish as the moving average converge divergence (MACD) is in negative territory, with red bars on the histogram. The RSI is also trading low at 38.90 and suggests that prices may continue to move lower if the bears are able to break below the $7.35 support level. The moving average indicator is currently at $7.64 and shows that prices have been trading in a bearish pattern over the past few days.
Chainlink price analysis conclusion
According to the Chainlink price analysis, the crypto asset has been trading in a bearish pattern today and is struggling to make gains. The coin has broken below the $8.00 mark and bears have managed to push prices lower again. The technical indicators are bearish and suggest that if bulls don’t make a comeback, then the coin could move lower.


