Polkadot price analysis: Bulls must defend $7 support
Because of the price’s considerable fall during the day, the Polkadot price analysis is leaning towards the downside. Since the bearish momentum is gaining strength quickly, price levels are steadily falling. Bullish retraces also attempted to break through the bearish spell earlier in the day, but yesterday’s pullback was more powerful. But, today’s price drop to $7.13 has caused the cryptocurrency to experience loss once more. Bulls must sustain the $7 level as support in order to prevent further price declines.
DOT/USD 1-day price chart: Cryptocurrency under the bearish domain as price drops heavily
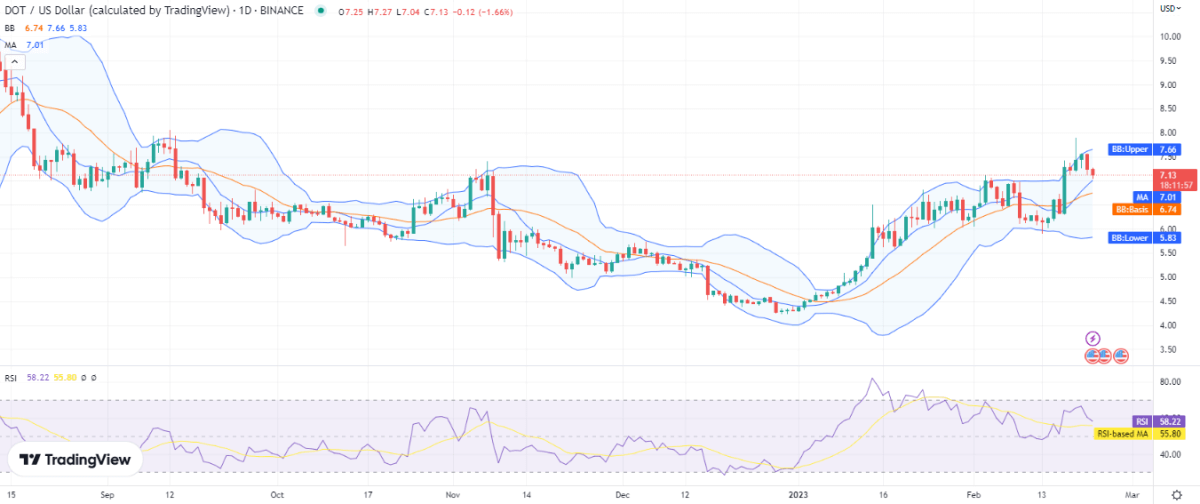
According to the 1-day Polkadot price analysis, the day is marked by a bearish trend. The price has significantly dropped as a result of the bears being able to maintain their advantage on the price chart. The downturn has caused the price to decline, and it is currently resting at $7.13. The price chart’s moving average (MA), which is currently at the $7.01 level for the day, is continuing in a stable position.

This should be interpreted as a bad sign for the future because the volatility has been on the rise all day. The Bollinger bands indicator is displaying the values below; the top value is $7.06 and the lower value is $5.83. The Relative Strength Index (RSI) score has also dropped to index 58.
Polkadot price analysis: Recent developments and further technical indications
After the price fell even further today, the Polkadot 4-hour price analysis indicates a strong negative trend. Price levels have fallen to the $7.13 level and are predicted to fall considerably further. According to what the RSI is showing, more and more sellers are pushing prices lower. The moving average value is currently resting at $7.33, which is still significantly higher than the current price.

The upper Bollinger band is now settled at the $7.74 position due to the recent increase in volatility, while the lower Bollinger band has begun to indicate a downward turn at the $7.11 position. The RSI score has dropped due to the decline and is presently struggling at 43.
Polkadot price analysis conclusion
The coin is about to retest $7 support in the near future, according to the offered 1-day and 4-hour Polkadot price analyses. This is due to the bearish momentum steadily increasing throughout the past day and the last four hours, which has driven the price down to the $7.13 level. The $7 level is a support level that will shortly be retested; if this support holds, bulls may stage a return.


