
Uniswap price analysis: UNI price plunges to $6.16 after a bearish market
The latest Uniswap price analysis reveals that UNI/USD has plunged to $6.16 after a bearish correction. The price has been trading low since the start of today, with more than 0.46% of losses in a single day. The selling pressure on the market has pushed the price further down, and it is showing no signs of recovery.
The support for UNI/USD pair is present at $5.97, which was breached today, and it is likely to provide more bearish pressure on the pair. On the other hand, resistance to the coin has been observed at $6.39, which may be tested in the coming days if a buying sentiment appears in the market.
Uniswap price analysis 24-hour chart: Bears drop UNI price to $6.16 as no buying pressure is seen
The 24-hour chart for Uniswap price analysis shows a bearish trend, as no buying pressure is seen in the market. The market has been trading inside a descending channel since the start of today’s session, with the price hitting a low of $5.97 earlier today. The market capitalization of the coin has also decreased in the past 24 hours, dropping to $4.87 billion, while its volume has decreased to $107 million.
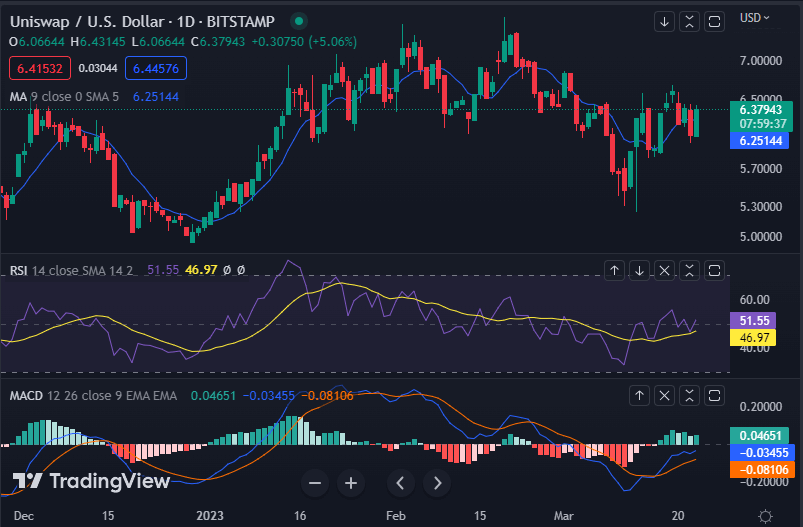
The moving average converge divergence (MACD) has moved below the zero line, with histogram columns going red, indicating a strong downward trend in the market. The relative strength index (RSI) has also dropped to 51.55, which is considered a neutral zone. The daily moving average indicator is currently showing a downward trend at $6.25, which is likely to act as significant resistance in the days ahead.
Uniswap price analysis 4-hour chart: Recent updates
The hourly chart for Uniswap price analysis shows that the price has been trading in a bearish trend, with the bears controlling the market. For the past few hours, the price has decreased significantly as the bearish momentum has been intensifying for the last few hours. The bulls need to gain strength in order to get the price back above $6.50, where some resistance is expected.
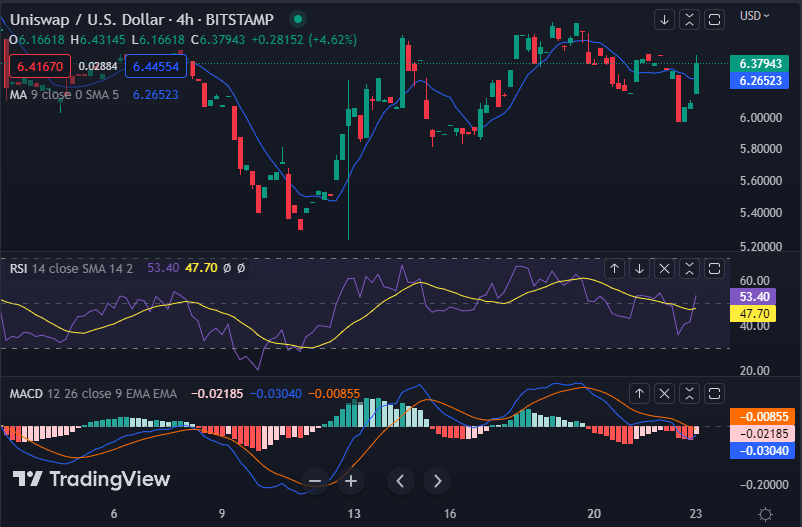
The technical indicators on the hourly chart have also shown a bearish trend. The RSI is also trading in the neutral zone, at 53.40, signaling that a reversal may be forthcoming if buying pressure appears in the market. The MACD indicator also shows a lower trajectory in line with the red candlesticks dominating the histogram, confirming that the bearish momentum is still in play. The moving average is currently at $6,.26, which is just above the current price.
Uniswap price analysis conclusion
Overall, Uniswap price analysis shows that a bearish correction can be seen in the market as there have been no buying pressures present in the past few hours. The support levels are weak and need to be tested in order to get some positive momentum. However, the technical indicators have shown a bearish trend, and it may take some time before any recovery can be seen in the market. The resistance levels should also be considered if there are signs of recovery in the price.


