Cardano price analysis: ADA loses value at $0.3956 as bearish pressure continues
Cardano price analysis shows a downtrend in the market as the bears have control of the market. The bearish momentum has been continuously at a peak, as the last hours have seen a major decline in the price value. The price has lowered to $0.3956, causing a reversal in the uptrend that followed earlier this day. As the short-term trending line is also showing downward movement, further reduction in price can be expected.
The price has been trading in a tight range between $0.391 and $0.40 levels for the past 24 hours. The support level for ADA/USD pair is present at the $0.391 mark; if the bearish pressure keeps on pushing Cardano down and it breaches this level, then it could reduce further toward the $0.38 mark as well.
Cardano price analysis 1-day chart: Bears dominate the market, pushing ADA down
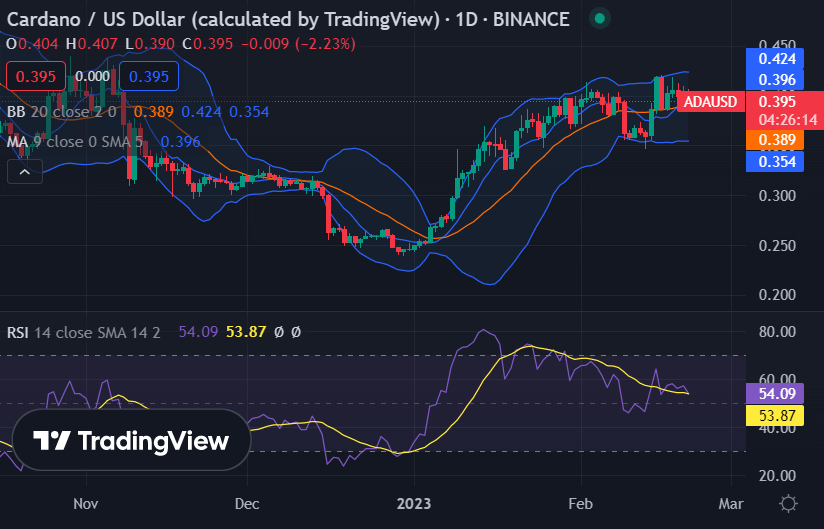
The 1-day Cardano price analysis indicates that the price has undergone a major decline today. That has been made possible by the bears, who have been able to interrupt the successive bullish wins. The bears have taken the price value down to $0.3956, with a decrease of 2.37% in the past 24 hours. The price is still present below the Moving Average (MA) value which is currently set at $0.396.

The Bollinger bands have been contracting for a while, and that indicates the presence of low volatility in the market. The upper Bollinger band is at $0.424, and the lower Bollinger band is present at $ 0.354, which is a tight range in which the price is trading. The Relative Strength Index (RSI) of Cardano has dropped to 54.09, which suggests that the price has more opportunity for a downward move as it is already in an oversold region.
Cardano price analysis: ADA bulls receive a great shock as price movement reverses abruptly
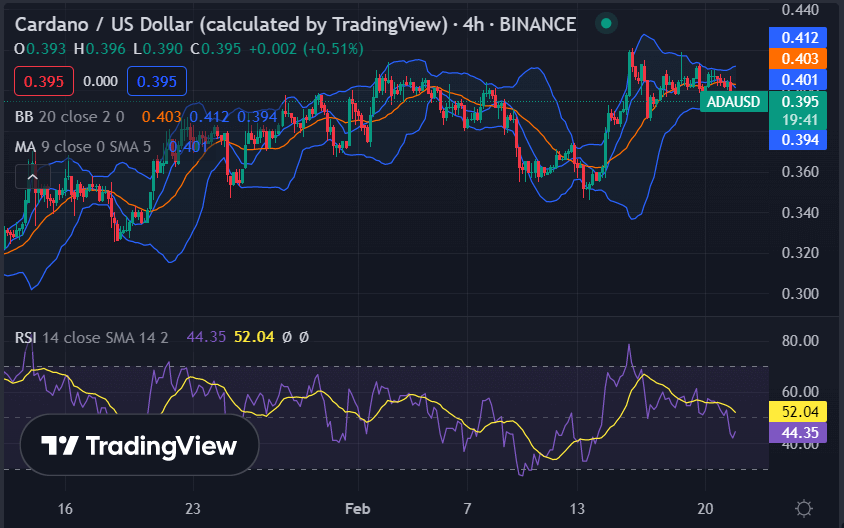
The 4-hour Cardano price analysis is going strongly bearish as the cryptocurrency has gone through a major loss in the last hours. The ADA/USD price has dropped to the $0.3956 level, which has been an unexpected blow.
Meanwhile, the 4-hour price chart is also showing the Moving Average to be at $0.401, and the Bollinger bands average at $0.403. The SMA 20 curve is also going downwards after covering a note-worthy distance through ascending movement.

Moreover, the upper Bollinger band is found at the $0.412 level, whereas the lower half is touching the $0.394 level. The Relative Strength Index (RSI) score has also decreased significantly because of the ongoing bearish activity and is now present at 44.35.
Cardano price analysis conclusion
To conclude the Cardano price analysis, it can be said that the bears have taken over the market and pushed ADA/USD down to $0.3956. The decrease in price value has happened abruptly, and the bulls are yet to regain control. Furthermore, Cardano is now facing resistance at $0.4068, which it needs to breach to witness bullish activity again. Lastly, some more downside pressure can be expected due to the bearish momentum prevailing in the market.


