Bitcoin price analysis: BTC steps down to $24,595 as bears exert control
The Bitcoin price analysis shows a negative trend, with the BTC/USD pair trading at $24,595. The bears have gained control and are pushing the price of Bitcoin lower as more selling pressures mount. At present, there is support present at $24,516, which may help to hold in the short-term if the bearish pressure persists. However, the bullish might resume if the support is breached and push the pair higher. The resistance level for the pair is at $25,126, which could provide a potential target for the bulls.

Apart from Bitcoin, other cryptocurrencies are also trading in red, with Ethereum (ETH) dropping by 1.81 percent and many altcoins such as Ripple (XRP) and Cardano (ADA) also decreasing in prices. The 24-trading volume for the crypto market has decreased by 15.28 percent in the last 24 hours, with a total of $28 billion worth of crypto tokens being traded. The market capitalization of the entire crypto market has dropped to $471 billion.
BTC/USD 1-day price chart: Bearish swing deflates price levels to $24,595
The 24-hour chart for Bitcoin price analysis shows that the price has been downgraded to $24,595 as a result of the constant downflow. The past few days have been quite encouraging for cryptocurrency as a strong bullish trend was going on. However, this trend reversed, and bearish pressure was exerted upon the prices, resulting in a decrease in the prices.

The price has gone below the moving average (MA) value as well which is standing at $23,846, indicating a bearish sentiment in the market. The 50-day moving average (MA) is showing a bearish crossover with the 200-day moving average (MA), which could also be seen as an indication of bearish sentiment. The RSI indicator is currently at 61.71, indicating that BTC/USD pair might face some more drops in prices if the bearish pressure intensifies further. The moving average convergence/divergence (MACD) indicator is showing as the red line is above the blue line, indicating that bears have taken control of the market.
Bitcoin price analysis: Bearish depression results in collapse below $25,126
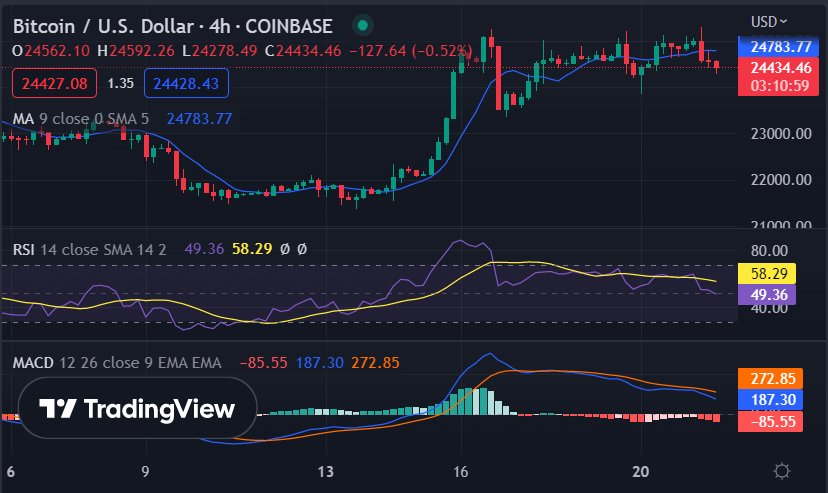
The 4-hour Bitcoin price analysis is showing signs of bearish momentum as the price decreased quite significantly. The price has been declining consistently as the cryptocurrency is showing a downward tendency. A reduction in price has been recorded in the last four hours as well as the price levels moved down to $24,595. Moving on, the moving average indicator is showing its value at $24,783, which is just above the current price level.

The RSI indicator is standing at 49.36 which suggests that bearish pressure will remain in the market if the price drops further from here. Moreover, the MACD histogram has turned negative, indicating that BTC/USD could face more losses in its prices soon. The MACD line is also below the signal line at present, showing a bearish crossover as well.
Bitcoin price analysis conclusion
Bitcoin price analysis is bearish at the moment, with BTC/USD trading at $24,595. A further downfall can be expected as the bears have been dominating for the past few hours as well. The price has been persistently moving down, which means that chances of improvement for the bulls are still on the limited side. The support level is currently at $24,516, which could provide a potential target for the bulls. However, if that doesn’t hold, then further losses in the prices can be expected.
While waiting for Bitcoin to move further, see our Price Predictions on XDC, Polkadot, and Curve


