Dogecoin price analysis: DOGE/USD moves lower and gets ready to retest previous support
Dogecoin price analysis has been quite bearish today. For the last few days, Dogecoin was already moving in a range between 0.071 and 0.079. Since the market almost touched the upper bounds yesterday, it was expected that Dogecoin’s market may dip today. And that is exactly what happened.

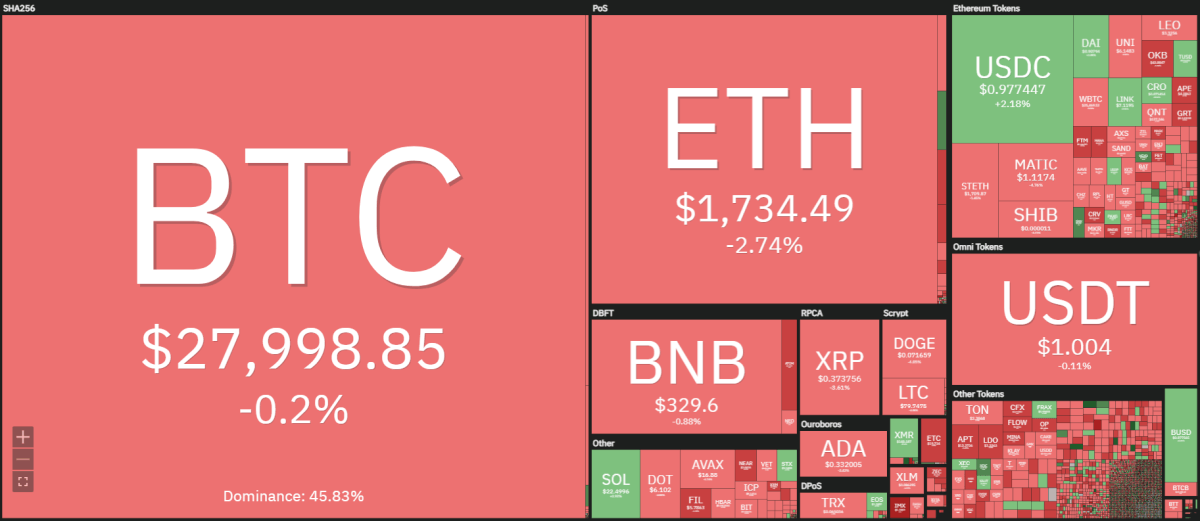
The cryptocurrency heat map above shows us that the whole market has been moving down today. Although there seems to be a tug of war between the bears and the bulls. For instance, the price of Bitcoin went lower by almost 0.2 percent. Ethereum also had a similar movement today as it marked a 2.74 percent decrease.

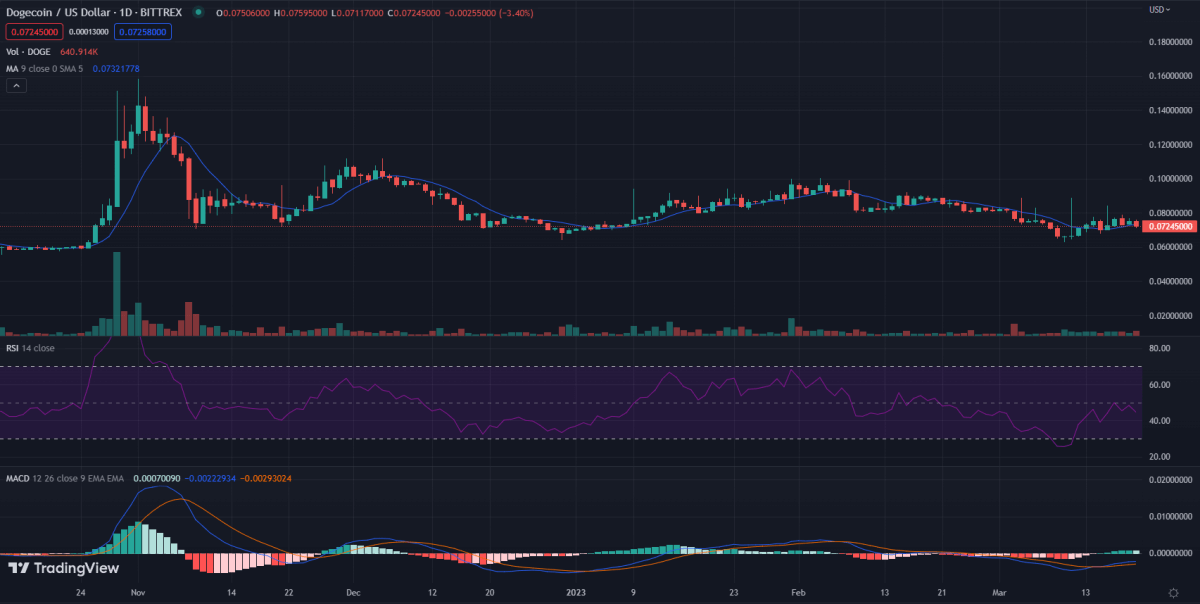
Now, let us look at the daily Dogecoin price analysis chart. It is obvious on the first look that the market was in a range in the last 4 days. At the same time, the nearest support levels are set around $0.063, which Dogecoin can retest in the next couple of days. For now, it appears to be breaking the range and heading towards the lower side.
Dogecoin 24-hour price movement
In the last 24 hours, Dogecoin has primarily been moving towards the downside. For instance, it closed at $0.0758 at 22:00 (UTC) on the previous day. Today, it closed at $0.072. Hence, from the standards of the Dogecon’s market, there has been a noticeable decrease in the price. Similarly, it is clear that Dogecoin’s market cap has taken a hit by 4.76 percent. But on the other hand, the trading volume has increased by 17.72 in comparison with the previous day.
4-hour Dogecoin price analysis: is DOGE/USD headed to the downside?

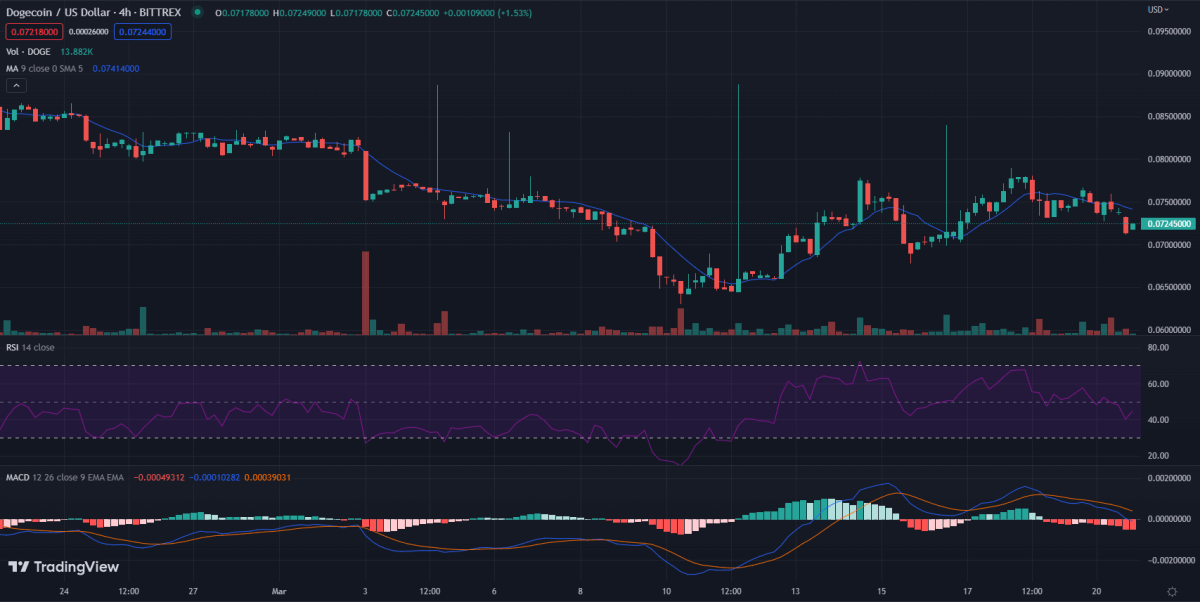
Well, it would not be fair to say that Dogecoin is certainly headed towards the downside. However, based on the 4-hour chart, we can see that the histograms on the MACD indicator are suggesting that the market is currently moving downwards. The RSI on the other hand is balanced. So, it is likely to be a slow and steady decline until the next support level is found.
Dogecoin price analysis: Conclusion
Today, the Dogecoin price analysis remains rather uncertain. Dogecoin has already broken the range and might be getting ready to retest the previous support line. Otherwise, it may form a new support level and rebound back into the range. The market’s sentiment is overall negative and there is a higher chance that Dogecoin will go lower and enter a new range. For a long-term analysis of Dogecoin’s price, read our Dogecoin price prediction.


