Pepe Coin Eyes a Holy Moly 900% Price Explosion
NOIDA (CoinChapter.com) — Pepe’s price has had a positive start to May 2024, with the token’s price painting a bullish rally with more than 35% gains since May 1 to reach a daily high near $0.000008 on May 6. However, bears have started booking profits, resulting in the memecoin paring some of its gains.
Pepe was one of the tokens that attracted massive attention from investors during the March memecoin mayhem, which saw the birth (and death) of several memecoin projects.
Yet, PEPE endured and has now formed a bullish pattern that could theoretically see the meme crypto token register massive gains.
PEPE Unfurls Bullish Flag
The frog-based meme token has formed a bullish technical setup called the “bull flag pattern.“
A bull flag pattern forms when a crypto token’s price experiences a near-vertical rise, creating the flag pole. This pattern commonly emerges in assets that are in a strong uptrend.
Following the steep ascent, the asset undergoes a period of consolidation, which creates the flag of the pattern. Despite the initial strong rally, the price holds steady as buying pressure persists. Typically, a breakout from this consolidation phase triggers another significant uptrend.

The pattern reaches completion when the price breaks out from the flag area, effectively resuming the prior upward trajectory. Traders project the breakout’s price target by adding the length of the flag pole to the breakout price level. This calculation helps in predicting the potential continuation of the price.
According to the rules of technical analysis, if the token confirms the technical pattern, the PEPE price might rally over 927% to reach the theoretical price target near $0.000086.
However, it is unlikely that the memecoin will rocket to the theoretical price target after a bullish breakout from the pattern. Yet, the pattern could attract more buyers to the market, which would in turn help Pepe coin confirm the pattern and register some gains before correcting.
PEPE Price Faces Stiff Resistance
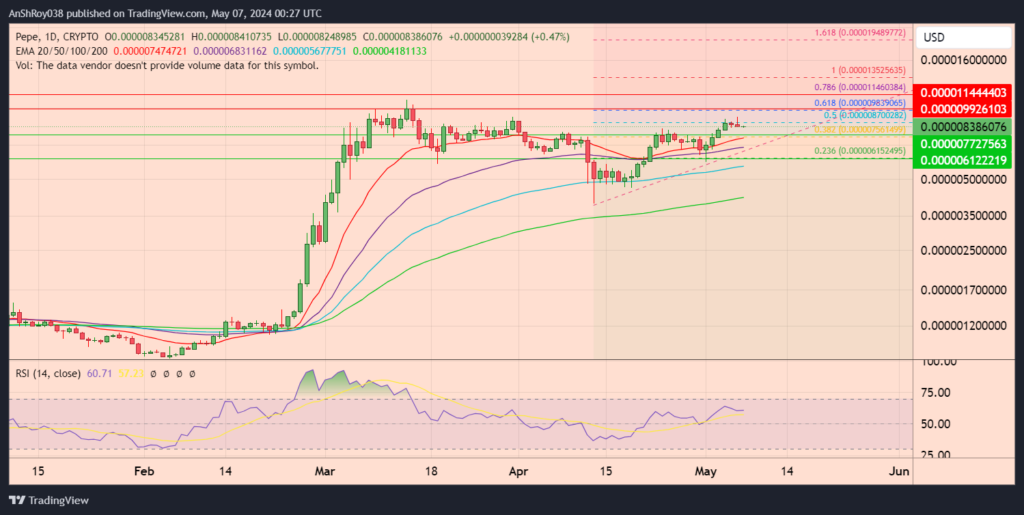
PEPE’s bullish rally started faltering on May 5 before bulls tried to push for the coveted $0.00001 price label on May 6. However, the bullish rally fell prey to strong resistance near the supply zone around $0.000009.
If bears continue selling, Pepe price could drop to the 20-day EMA (red wave) support near $0.0000077.

Moreover, failure of the immediate support level could result in the memecoin’s price testing the 0.236 FIB support near $0.000006.
On the other hand, a bullish rally from this point would help PEPE coin price reach the resistance near $0.0000099. Additionally, breaking and consolidating above the immediate resistance could help the token target the resistance near $0.0000114 before paring gains.
The relative strength index, a momentum oscillator, remained neutral for PEPE, scoring 60.71 on the daily charts.
The post Pepe Coin Eyes a Holy Moly 900% Price Explosion appeared first on CoinChapter.